


X-ray micro-CT (computed tomography) is a powerful tool that allows researchers to non-destructively visualize and study internal structures of objects and materials. Three-dimensional CT data is rich in information, but a large amount of information can be challenging for our brains to process. This is why presenting CT data clearly and effectively takes a bit of skill, especially when communicating your research findings in journal articles or presentation slides.
I have been presenting webinars about X-ray CT for over five years and have helped many CT users generate effective graphical representations of their research results. In this article, I will share some of the CT image representation techniques I’ve learned over the years after seeing both good and bad examples:
- Choose the right images
- Set brightness and contrast correctly
- Use cross-sections and rendering wisely
- Avoid counter-intuitive representations
- Add graphs
Choose the right images
The first step is to use the right images. If the data is noisy or low-resolution, you will struggle to convey your point using your CT images. In other words, they won’t be convincing. You need to use the right images for more than just presentation purposes. You should select the right images at the beginning of your analysis, because analyzing low-quality images can result in errors in the extracted parameters.
The CT cross-sections below were collected on the same sample (CFRP: carbon fiber reinforced polymer) using three scanning conditions. Image A’s noise level is low, but the contrast and resolution are also low, and it is hard to see the individual carbon fibers. Images B and C have enough resolution and show good contrast, but Image C’s noise level is high, making it difficult to distinguish the polymer (medium gray) and carbon fibers (light gray).
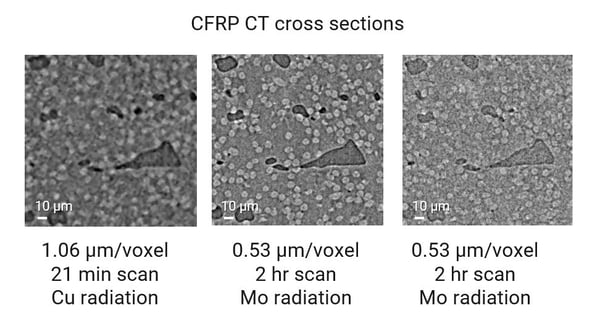
(A: 1.06 µm/voxel, 21 min scan, Cu radiation, B: 0.53 µm/voxel, 2 hr scan, Cu radiation, C: 0.53 µm/voxel, 2 hr scan, Mo radiation)
Image B is the best representation of the sample structure. Using image A or C could diminish the clarity or even the credibility of your research findings.
Read: How to Improve the Resolution of X-ray CT Images
Read: How to Improve the Signal-to-noise Ratio of X-ray CT Images
Set brightness and contrast correctly
We compared the three images above for data quality. Contrast is one of the essential qualities to evaluate. While the absolute difference of the average gray values between materials is fixed, the representation of the contrast can be adjusted.
Most CT image display software has brightness and contrast or window level adjustment tools. These tools change the LUT (look-up table), which defines what CT values are assigned to black and white. Some software also allows you to use a non-linear relationship between the CT value and the gray value.
The figure below shows three LUT settings applied to the image B we chose as the best image above:
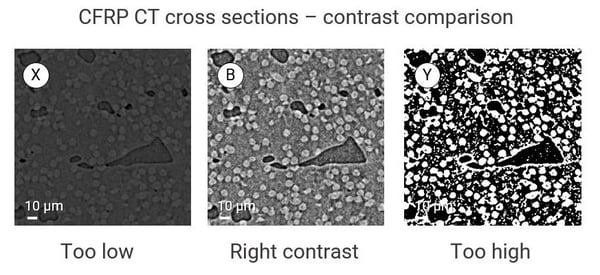
The contrast is set too low for image X on the left. Depending on the computer screen or printer used to represent this data, you might not be able to see any contrast. The original LUT setting, B, in the middle looks right.
You can also set the contrast too high, as you see in image Y on the right. When the contrast is set too high, the image is binarized, and the middle-level gray information is lost. This is not the best representation of the data unless you intend to show a segmented (binarized) image.
When you submit your images for print publication, print the proof and check if there’s sufficient contrast.
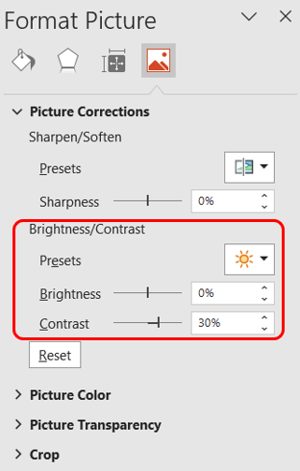
When giving a presentation using a projector or large monitor, check if the images on your slides look good on the screen before your talk starts. If brightness and contrast need to be adjusted, you can do so in Microsoft PowerPoint, for example. Right-click on the image and select “Format picture.” The panel shown below will appear, and you can adjust the brightness and contrast.
Use cross-sections and rendering wisely
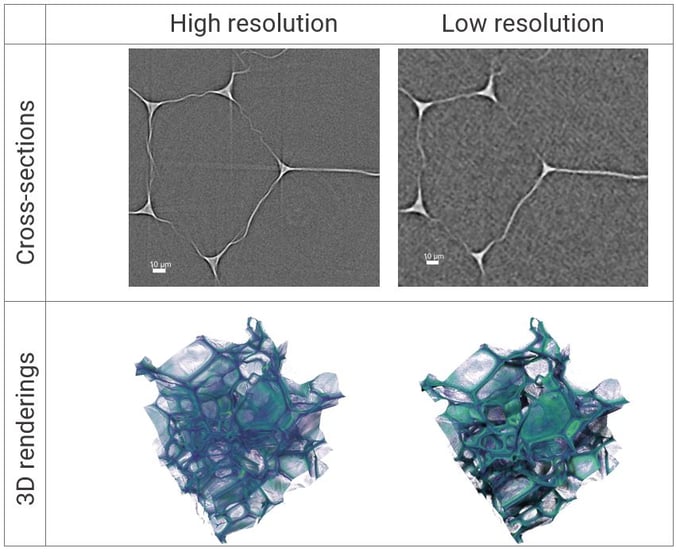
The example below compares high- and low-resolution CT scans of a polyurethane foam material, voxel size 0.26 µm and 0.79 µm, respectively. Cross-sections are a better way to represent data to communicate that, for example, a voxel resolution of 0.26 µm is necessary to capture the thin cell walls and calculate an accurate porosity.
A 3D rendering might look “pretty,” but it does not help the audience compare the quality of these two images; thus, it is not a suitable representation of CT data in this case.
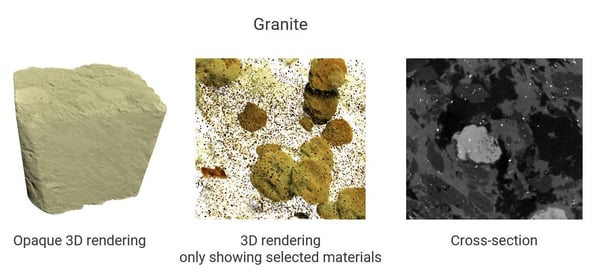
Let’s take a look at another example. The figure below shows three ways to show a CT image of a piece of granite. The opaque 3D rendering helps to show the external shape of the sample, but it does not show the multiple phases and their distributions.
You can set a threshold of gray level and make lighter phases transparent, as shown in the middle. This is an excellent way to show the shapes and distributions of inclusions in a 3D space. However, this view does not show all components.
To show all components, you might want to go back to a simple cross-section, as shown on the right. This view shows all phases with different densities in varying gray levels.
The following example shows CT scans of a foam material before and after compression stress was added. The top two images are renderings of the solid material with light and shadow effects. They show the details of how the polymer cell walls are deformed by compression stress. However, it is hard to see the cell size changes in these figures.
The bottom two images show the cell void space, color-coded for the cell size. These images do not show the details of the polymer cell walls, but they clearly show the cell size distribution and their changes quantitatively.
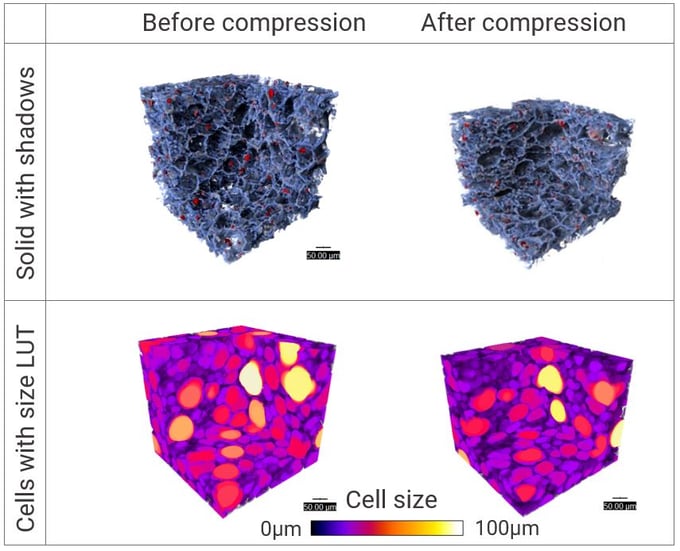
Depending on what you want to communicate, choose the right representation from cross-sections, 3D rendering, with or without light and shadow effects, or color-coded quantitative analysis results.
Avoid counter-intuitive representations
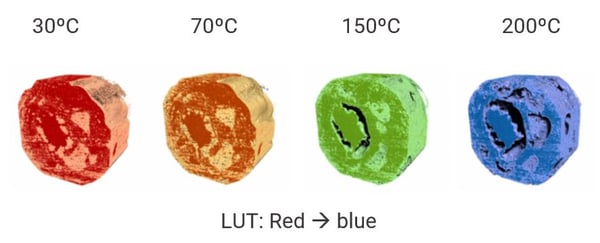
What color do you think of for high temperatures? Most people think of red or orange. On the other hand, blue represents low temperatures, as you often see in heat maps and the colors of the hot and cold water faucet handles.
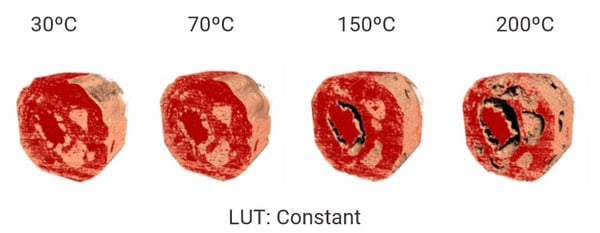
When representing CT images collected at different temperatures, violating this red-hot and blue-cold convention can confuse your audience. The example below shows CT scans of salami collected at different temperatures. There is nothing incorrect about this figure, but the coloring is counterintuitive and causes unnecessary friction in our brains.
The figure below uses the red-hot and blue-cold convention, making it easier to digest the communicated information.
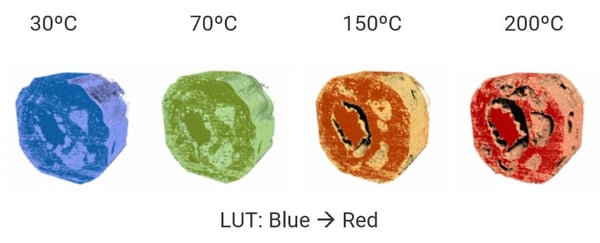
When there are many temperature steps, coloring them according to the temperature can help our brain process more information at once. However, this example contains only four temperatures. In this case, everything shown in one color, as shown below, might actually be easier to comprehend.
When you are not sure which representation is the easiest to process, you can show different versions to your friends and colleagues and ask them which one is the easiest to digest or is the least confusing.
In any case, let’s not forget to annotate all scans. Don’t use colors as the only indicator, because certain colors look indistinguishable to colorblind people and, also, your figure could be reproduced in grayscale elsewhere.
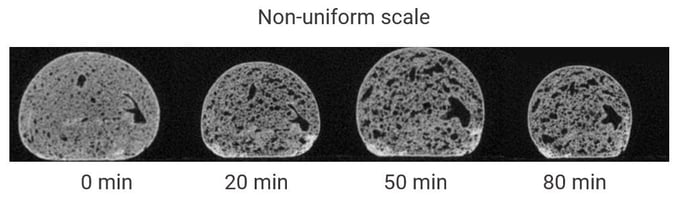
Color is not the only element that can confuse people. Inconsistent scale is another. The figure below shows CT cross-sections of bread dough scanned at different times. The dough rises over time, and you can see pores form and grow. However, because these scans are represented on a non-uniform scale, you cannot tell this is what is happening.
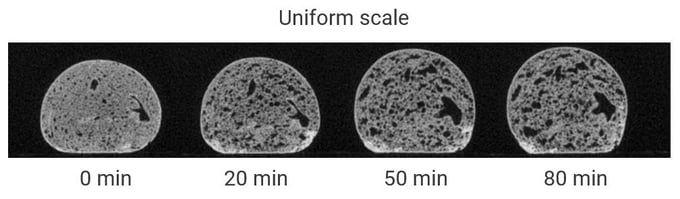
The figure below shows the same set of scans on a uniform scale. Now you can easily see the dough rising and pores growing.
Add graphs
We can use graphs to represent measurements and quantitative analysis results obtained from CT scans.
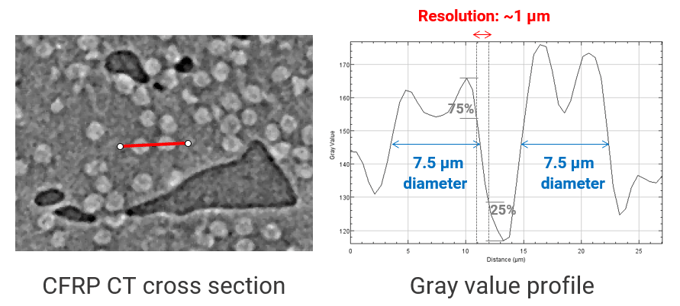
The figure below shows a CT scan of CFRP (left) and a gray level profile across the red line in the CT cross-section (right). The gray level profile is a great way to show the sharpness of the polymer-carbon fiber interface, the contrast between the two materials, and the diameters of the fibers. These parameters are not easy to depict in the cross-section.
Below is a result of the CFRP fiber aspect ratio analysis. The 3D rendering on the left shows fibers color-coded for the aspect ratio, ranging from thin and long (purple) and stubby to short (red).
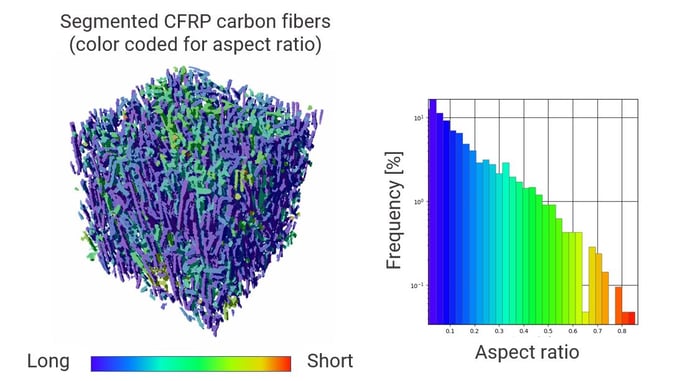
The color-coded 3D rendering represents where these fibers are and how they are distributed in the 3D space. However, it is not easy to tell the percentage of long and short fibers. A histogram like the one shown on the right above provides that percentage information much better.
As you can see in these examples, graphs can supplement CT data, especially when reporting quantitative analysis results.
What to do now?
Some people naturally know the best way to present data, but others have to consciously figure it out. If it doesn’t come naturally, what should we do?
You can review this article and make sure you are not doing what was shown as bad examples. If you have already done so, change your presentation using a style shown as a good example.
Looking at someone else's work critically can help you learn this skill. The next time you watch someone’s presentation or read their paper, observe if you can process the graphical representation of the data effortlessly or if you feel confused. Then think about why it is easy to understand or why it confuses you.
If you are having a hard time figuring out how to represent your data or are looking for a good software tool to generate figures, our team of CT experts can help you. You can talk to one of our CT experts by clicking the “Talk to an expert” button at the top right of the page or send us a message at imaging@rigaku.com