


Data collection is the most important step in computed tomography because, it goes without saying, if your data are bad, your analysis results will be bad as well. It can undoubtedly be frustrating to find artifacts in your CT data following reconstruction. Unfortunately, artifacts can and will occur in your CT data. I’ve found that the best way to deal with artifacts is to be able to recognize them and understand why they happen. This knowledge will help you decide how to minimize or even eliminate them in your future data collections.
Artifacts are structures you see in reconstructed data that are not physically present in the originally imaged object. They arise because of discrepancies between the mathematical assumptions used for 3D reconstruction calculations and the reality of the physical measurement conditions. For example, 3D reconstructions assume that X-rays are monochromatic, that samples do not extend beyond the field of view (FOV), and that all pixels in the detector respond uniformly. These assumptions, as well as others, are often incorrect and that causes reconstruction errors and the introduction of artifacts into your CT data.
What are the main types of artifacts and how do we correct for them? In this article, we’ll review the common artifacts, what causes them and ways that you can minimize their effects.
- Beam hardening artifacts
- X-ray scattering/refraction artifacts
- Ring artifacts
- Metal artifacts (photon depletion/starvation)
- Aliasing
- Sample movement
- Incorrect center/focus
- Cone beam artifacts
Beam hardening artifacts
Beam hardening artifacts are quite common and can manifest in several ways. When using a polychromatic X-ray source for data collection, the mean energy of the X-rays increases as they pass through the imaged object. This happens because lower-energy photons are absorbed more rapidly than higher-energy photons. This results in harder X-rays, which is where the name “beam hardening artifact” comes from. You typically see beam hardening effects show up as “shading” artifacts. You may have heard the term “cupping artifacts,” which are observed when imaging a sphere or uniform cylindrical object. In that case, it’s called cupping because a “cup” is round. But, in fact, these shading artifacts are common when measuring data for any material that is uniform and thick. In this type of artifact, the true density of an imaged object is underestimated and you see differences in gray level values between the edge and center of the cylinder (Hunter, A., McDavid, W., 2012. Dentomaxillofac. Radiol. 41, 217–223). Specifically, the gray levels in the center of the object are lower than at the periphery, as shown in the example below.
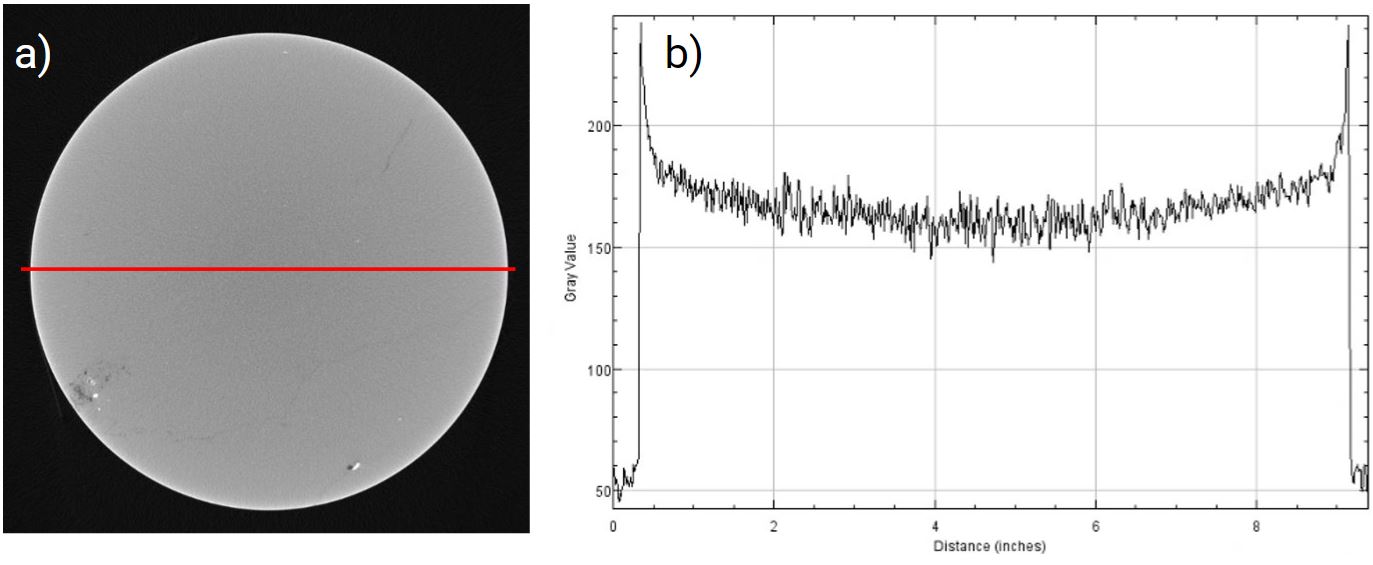 Illustration of cupping artifact for a rock core sample. a) 2D cross-section of CT data for rock core. b) plot of the gray value for the red line in a)
Beam hardening effects, like cupping, can be improved using both mechanical and computational methods. For example, one can reduce beam hardening by placing a filter between the X-ray source and sample. Typical filter materials include thin foils of aluminum or copper. Using a filter has the effect of “pre-hardening” the incident X-ray spectrum by removing low energy X-rays from the incident beam. Filters also reduce the flux of the incident beam, so you must consider signal-to-noise ratio for your data when using them. One can also use computation tools to correct for beam hardening during the reconstruction calculation. Another method uses data collected for phantom objects that mimic the original object size and shape. So, it is possible to correct projection data by using theoretically or experimentally derived correction data.
Read: What Is Beam Hardening in CT
Read: How to Reduce Beam Hardening Artifacts in CT
X-ray scattering/refraction artifacts
As X-rays pass through a sample, different interaction processes occur, including X-ray scattering. In this case, X-rays are scattered or refracted away from the primary beam path. When this happens, you often see streaking artifacts in reconstructed data. Several factors influence scattering artifacts, including X-ray tube voltage, sample geometry and scan parameters. For example, scatter effects are greater when higher X-ray voltages are used, so filters can usually help. Additionally, scattering artifacts are particularly pronounced when straight edges of a sample are parallel to the incident beam (see image below), making it difficult to cleanly segment edges and surfaces of objects.
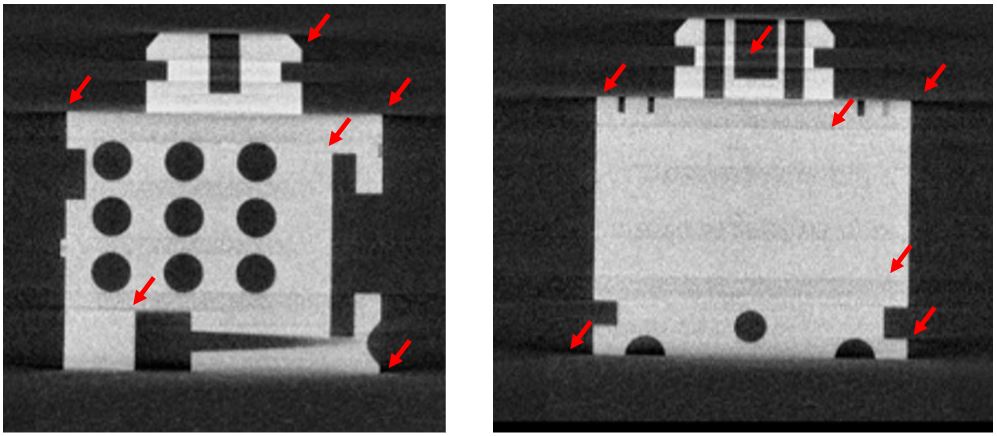 Illustration of streaking artifacts (red arrows) for a 3D printed sample.
Tilting the sample so there are fewer solid surfaces parallel with the X-ray beam reduces these streaks. Also, scatter correction techniques can be implemented during reconstruction. One such technique removes scatter artifacts by first estimating the amount of scatter and subsequent subtraction from projections (Lifton, J.J., Malcolm, A.A., McBride, J.W., 2015. Meas. Sci. Technol. 27, 015007). Other techniques use Monte Carlo simulations to estimate X-ray scattering from a sample (Thierry, R., et. al., 2009. Nucl. Instrum. 598, 611–619).
Ring artifacts
Another common type of artifacts in CT data are ring artifacts. These appear as concentric rings in 2D cross-sections and are caused by nonuniform response from pixels in the detector. A couple of examples are shown below for 2D cross-sections of maize and walnut samples.
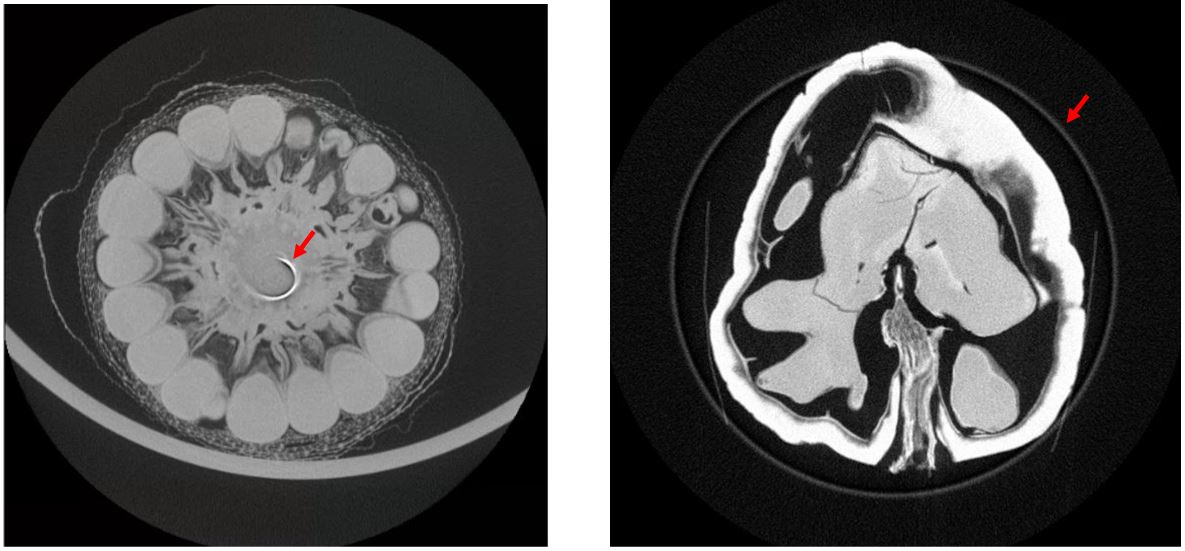 Illustration of ring artifacts (red arrows) in 2D cross-sections for maize and walnut data, respectively.
Ring artifacts are relatively easy to correct, either by detector calibration or by using sample or detector offsets during data collection. You might also check the front face of the detector or upstream filter to see if there is any debris or damage to either.
Metal artifacts (photon depletion/starvation)
Metal artifacts are particularly troublesome to deal with and may be caused by a number of physical effects, including beam hardening, X-ray scattering, and exponential edge-gradient effects (EEGEs) (Wu, M., et al., 2014. Med. Phys. 41, 121910). Metal artifacts are sometimes referred to as photon depletion or photon starvation artifacts. They appear in 2D cross-sections as severe streaks that occur near heavily absorbing material. Of course, some of these effects can be attributed to scatter; however, streaks are also caused by highly absorbing materials, like metals. Metals have high absorption rates and, as a consequence, intensity recorded on the detector behind this material may have a gray level close to zero. Therefore, materials behind the highly absorbing one are sometimes not observed and reconstructed data have severe streaking, as shown below.
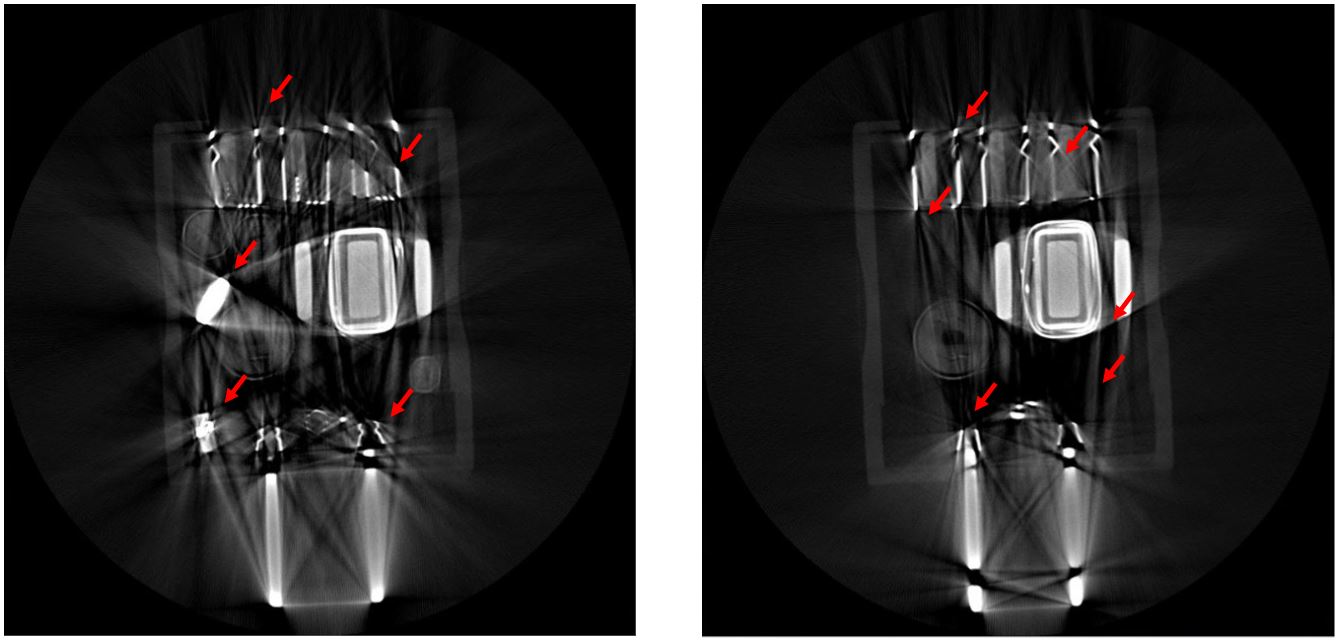 Illustration of metal artifacts (red arrows) in 2D cross-sections of a plug outlet.
There are a couple of ways to deal with metal artifacts. You can minimize them by placing a filter between the source and sample. In this case, you may also want to increase the X-ray voltage used for your experiment so X-ray photons are more likely to be transmitted through high-density parts of the sample and subsequently measured on the detector. Another approach is to apply metal artifact corrections during the reconstruction step. For example, a common approach replaces projection data in the metallic region with reasonable values to produce an image with fewer streaks where replaced data are generated using a sinogram (or projection) completion method (Kalender, W.A. et. al. 1987. Radiology. Published online Aug 1 1987, Abdoli, M. et. al. 2010. Medical Physics 37, 6166–6177, Meyer, E. et. al. 2010. Med. Phys. 37, 5482–5493.).
Aliasing
Aliasing is an artifact that results from undersampling. Specifically, aliasing occurs when too few projections are collected and is easily recognizable by fine stripes that appear to be radiating from the imaged object, as shown in the figure below.
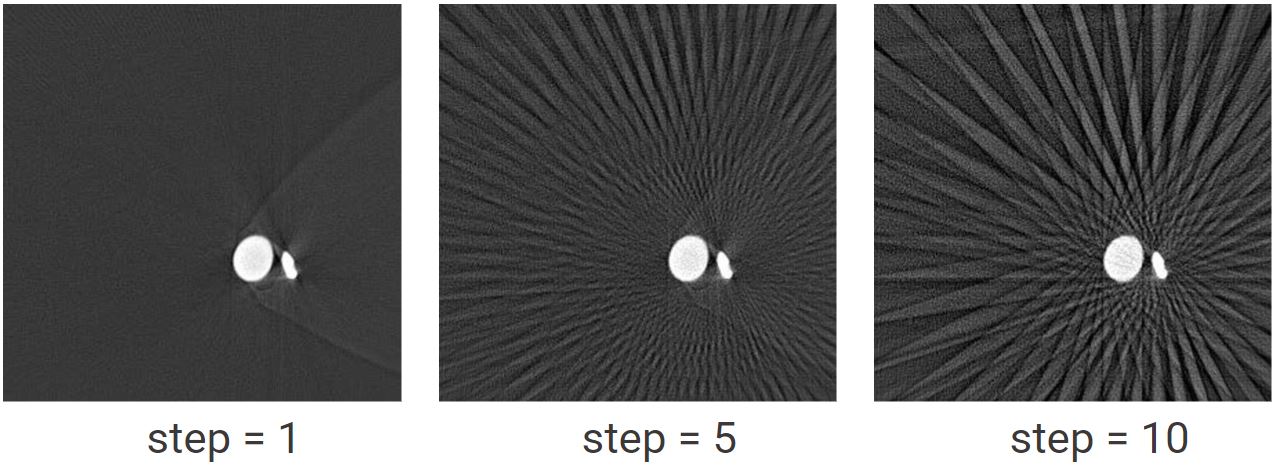 Illustration of aliasing artifacts in CT data. CT data for step = 5 and step = 10 were reconstructed using only 10% and 20% of the original data, respectively. You can see the effect of using too few projections as streaks.
In cases that are not too severe, aliasing artifacts may have no significant effect on your ability to extract quantitative information from your CT data. When imaging an object with fine detail, though, aliasing can cause problems in resolving features. Aliasing artifacts are easily corrected by recollecting data with more projections. So, there’s an easy fix if the sample is still available for additional imaging experiments.
Sample movement
When a sample moves during data collection, you can see doubling of features or smearing in the reconstructed data. For example, the image below shows 2D cross-sections for CT data of a flower.
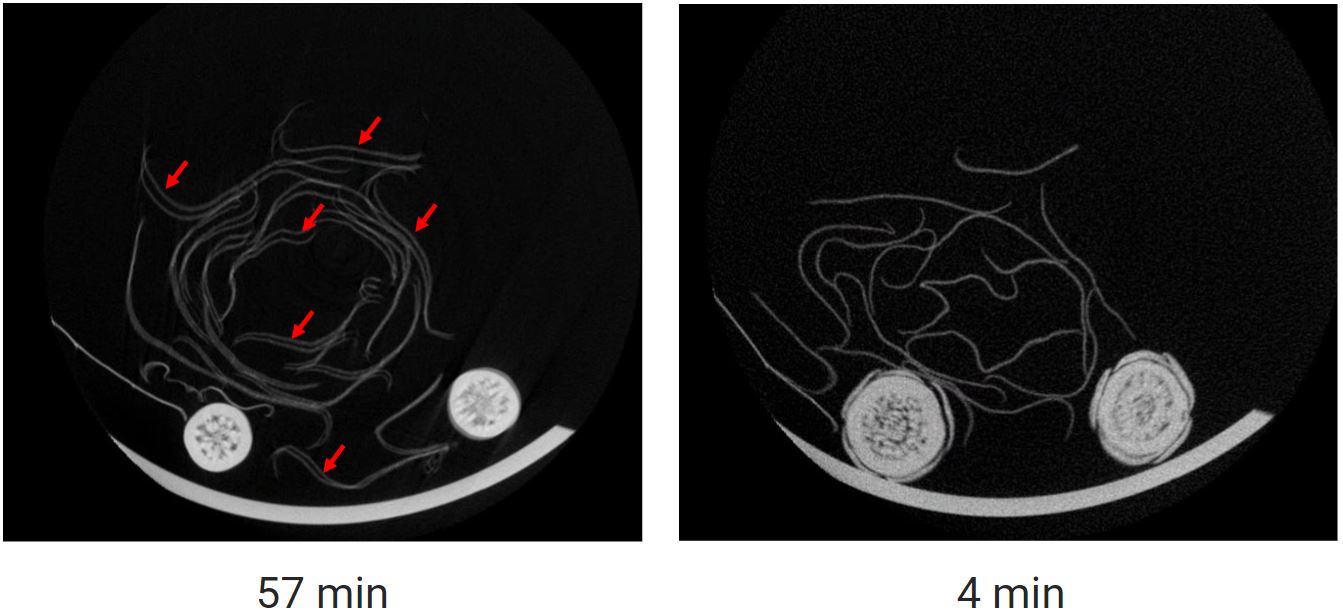 Illustration of artifacts caused by sample movement (red arrows) for a flower sample. These artifacts can mostly be eliminated by collecting fast scans.
The simplest way to correct for sample movement artifacts is to better secure the sample to minimize movement during CT data collection. In cases where this is not possible, try collecting fast scans. In the example above, reducing the total experiment time from 57 to 4 minutes was sufficient to eliminate sample movement artifacts in these data. Alternatively, you might consider using a CT system that utilizes a gantry system, in which case the X-ray source and detector rotate about a fixed sample.
A variety of methods can be used to secure your sample. For example, glues or adhesive tape are commonly used to secure samples to the rotation stage. In some cases, you may need to embed your sample to prevent movement. In those cases, low melting point agarose, resins or epoxy are options for embedding media. Nevertheless, some samples may be resistant to all of these approaches, such as when the sample experiences time-dependent deformation/change. In those cases, fast experiments or synchrotron sources may be required to obtain high-quality data.
Incorrect center/focus
Reconstruction often requires you to set the correct centering offset between the sample rotation axis and detector center. Although CT scanners are mechanically aligned to make these axes coincident, there is often a micron-level misalignment that needs to be corrected. If an incorrect value is chosen, you will observe smearing or doubling artifacts in the reconstructed data, as shown in the figure below.
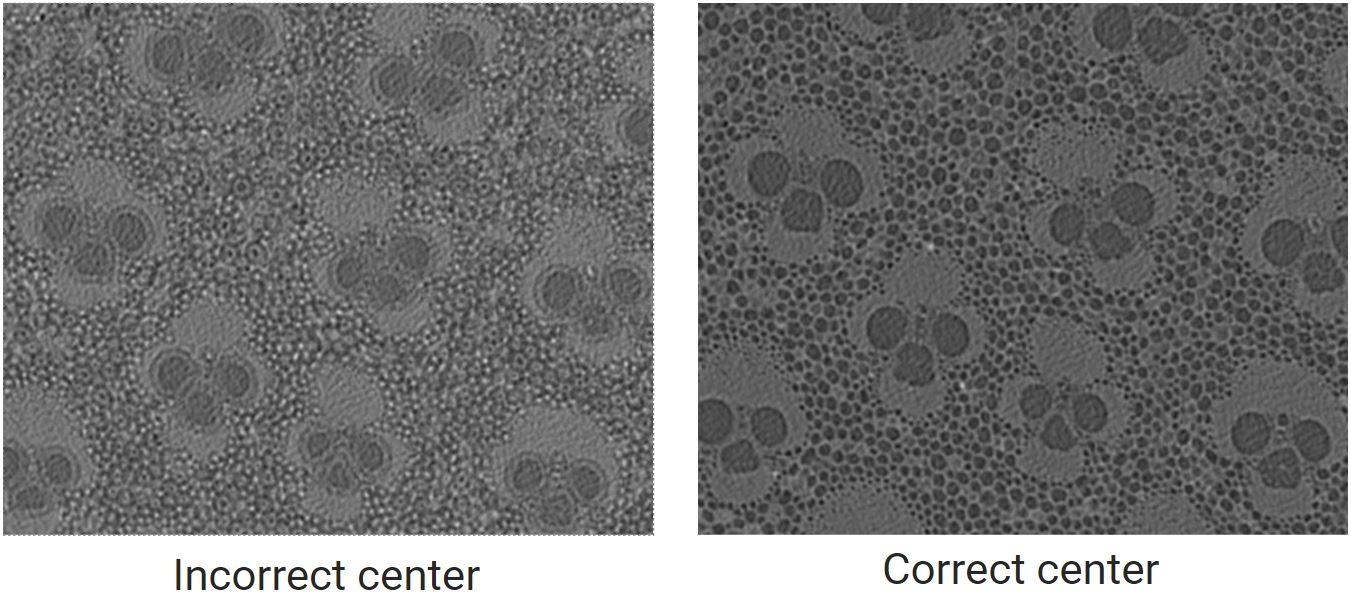 Artifacts caused by incorrect center for a bamboo sample. On the left, voids inside the bamboo sample appear to have smeared or doubled boundaries while on the right void boundaries are sharp and in focus.
Incorrect centering artifacts are easy to prevent by simply choosing the correct center value. Reconstruction programs will include center corrections tools, where a single slice of data is reconstructed using a range of center values. You simply pick the center value for which the data are in focus and then reconstruct using this value. So, this artifact is easily preventable.
Cone beam artifacts
Some artifacts are caused by the geometry of the X-ray CT system used for data collection. For example, cone beam artifacts are present when using a cone beam system. You can easily see the result of this artifact by collecting data for a tool called a Defrise phantom, shown in the figure below.
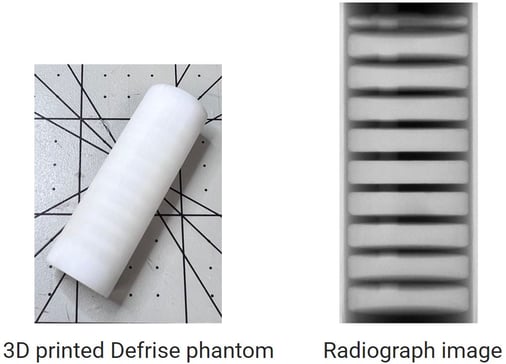 Cone beam artifacts can easily be visualized by collecting data for a Defrise phantom (left). A radiograph image for the phantom shows smearing artifacts as the cone angle increases away from the center plane.
In this case, data were collected for a 3D-printed Defrise phantom that is composed of alternating 1 mm plastic and 3 mm air gaps. A radiograph collected for this sample shows smearing that becomes more severe as the angle from the plane containing the X-ray source increases. Cone beam artifacts can be reduced by using corrections during reconstruction (Choi, S et. al. 2018. IEEE Access 6, 54595–54606., Minnema, J. et. al. 2021. Phys. Med. Biol. 66, 135015., Han, C., Baek, J., 2019 Opt. Express 27, 10108.)
Takeaways
As we’ve seen, artifacts are changes in CT data that occur during reconstruction. These errors are inevitable but can be ultimately improved by paying attention to both the experimental conditions and the computation tools used when reconstructing CT data. Most importantly, you need to be able to recognize artifacts and understand their causes so you can ultimately decide the best approach to take for your experiment. It’s likely you may recognize one or more of these in your data and, with a solid understanding, you’ll know the best approach to deal with them.
If you have questions about artifacts or other aspects of CT data collection, we would love to help. You can reach out to us by email or by using the "Talk to an Expert" button.