


We have said, “Segmentation is the first step of CT (computed tomography) image analysis” in our webinars and workshops. What is the next step? The next step is “refining” segmentation because the initial segmentation results are often not good or “clean” enough for quantitative analysis.
Segmentation of CT data can often result in errors or falsely labeled pixels/voxels due to noise and other artifacts. So, you’ll need a set of tools that help you correct the errors and fine-tune segmentation results prior to quantitative analysis.
In this article, you will learn how to refine segmentation results using tools like morphological operations and to further segment regions of interest based on the properties of each element, such as void size, in your segmented data.
Why do we need to refine segmentation?
The ultimate goal of X-ray CT data analysis is to quantify features we observe in CT images. To quantify features, we first need to segment the CT images, which are just grayscale pixels/voxels. During segmentation, each pixel within an image is given a label that assigns it to a specific region of interest (ROI).
There are many tools used for segmentation, including thresholding, machine learning, and deep learning. Though some are more powerful than others, it can be said that no segmentation tool is perfect. As a result, some pixels are incorrectly labeled. So, additional tools are required to fine-tune segmentation results.
To illustrate incorrect labeling, the figure below shows a CT cross-section (left) and segmentation results (right) of a foam sample where thresholding is used to assign pixels as either polymer (white) or void (black).
Yellow circles indicate where some void pixels are incorrectly assigned as polymer pixels and some polymer pixels are assigned as void pixels. So, further refinement of these segmentation results is required. In this article, we share some tools used to fine-tune segmentation results to more accurately fit reality.
![]()
In addition to refining segmentation results, we often want to further partition groups of pixels within ROIs. For example, we may want to examine a group of ROIs with respect to their size distribution. The figure below shows an example where maize kernels are separated, and their size distribution is quantified.
%20kernel%20volume%20distribution.jpg?width=600&height=339&name=Maize%20(corn)%20kernel%20volume%20distribution.jpg)
In other cases, we may want to exclude regions from our analysis; for example, regions that intersect the image border. Luckily, many tools are available for these types of post-segmentation refinement.
How do we refine segmentation?
There are several tools used to refine segmentation results. These include operations that reassign incorrect pixels in ROIs, operations that look for connections within ROIs, tools that allow further segmentation of ROIs, and more. Here we will look at some of these tools and illustrate how we can use them.
Morphological operations
Morphological operations are commonly used tools for refining segmentation results. They work by probing an image with a structuring element (SE) to test how it intersects with an ROI. The structuring element probes the image at all locations and makes conclusions based on whether the element fits or does not fit within a region’s shape.
The most basic morphological operations are dilation and erosion. Dilation adds pixels to the boundaries of objects, while erosion removes pixels on object boundaries. The number of pixels added or removed from objects depends on the size and shape of the SE used to process the image. Both dilation and erosion change the size and shape of the object.
Dilation and erosion
Dilation probes an ROI with the SE to test whether the SE intersects with pixels within the ROI. It results in an ROI larger than the original. Additionally, it creates connections between components and fills holes within components. The figure below illustrates an example of dilation. In this case, an original image of light blue shapes is probed with a disc-shaped SE.
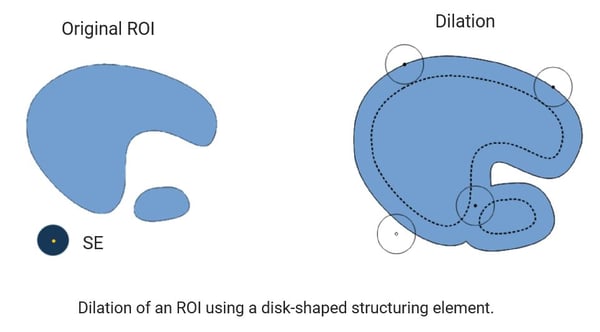
Images adapted from https://imagej.net/plugins/morpholibj
Erosion probes the ROI to test whether the SE is fully contained within the ROI. It results in an ROI smaller than the original. Additionally, it removes thin lines and small, isolated objects that are thinner or smaller than the SE. It can also separate two objects that are connected by a thin line or “neck.” The figure below illustrates an example of how erosion works.
.png?width=600&height=353&name=MicrosoftTeams-image%20(20).png)
Images adapted from https://imagej.net/plugins/morpholibj
Closing and opening
Often, erosion and dilation are used in combination. For example, the result of dilation followed by erosion is called closing. Closing removes small holes within an ROI. It can also connect structures that were separated by a thin space. In a symmetric way, the result of erosion followed by dilation is called opening. Opening removes structures smaller than the SE. It also separates two objects that are connected by a thin line or a “neck.”
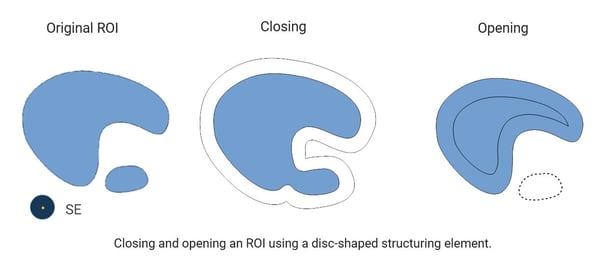
Images adapted from https://imagej.net/plugins/morpholibj
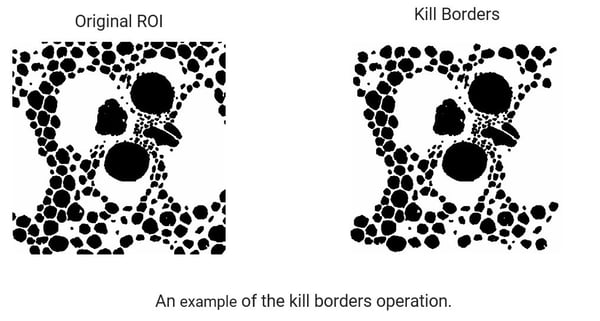
Kill borders
The kill borders operation removes objects touching the border of an image, as shown below. This can be useful when you want to eliminate objects that do not represent their accurate shape or size because they are truncated by the image border.
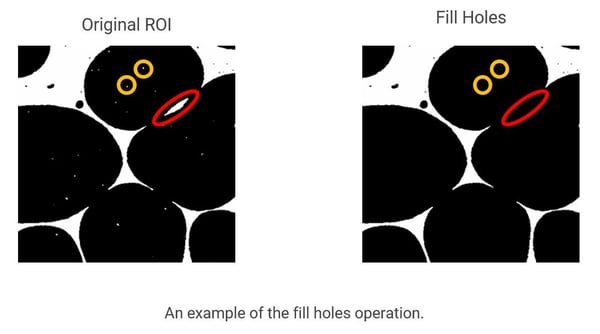
Fill holes
Fill holes operation removes holes inside shapes in an image. Fill holes has the benefit that the ROI shape does not change; however, you should be careful when using this operation because it could fill large "real" holes that shouldn't be filled. The figure illustrates how fill holes works (yellow circles) and illustrates how “real” holes are incorrectly filled (red circle).
Watershed transformation
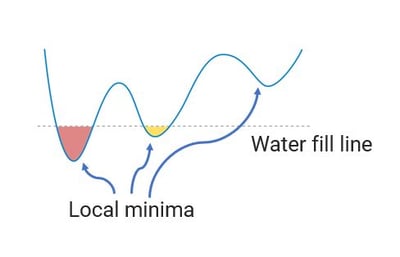
The watershed transformation is used to separate connected components within an ROI into separate objects. Let’s consider the picture below, where each object in an ROI is a basin. There are three basins corresponding to three adjacent objects within the ROI. Now imagine that it starts raining and the basins start to fill.
 Images adapted from https://imagej.net/plugins/classic-watershed
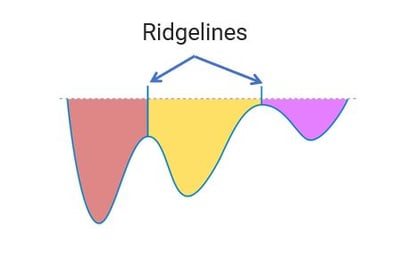
Eventually, the basins fill and bodies of water between neighboring objects will start to touch (bottom of the figure above). This point of contact is marked as a ridgeline, or edge, of the object.
Images adapted from https://imagej.net/plugins/classic-watershed
To perform watershed, we use a distance transform. As we saw earlier, the watershed operation requires that each object in the ROI be a "basin." So, how do we transform objects in our ROI into basins?
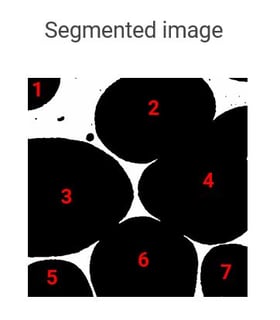
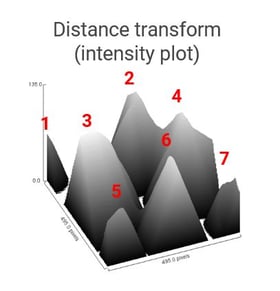
Let’s consider our segmented foam image shown below, where seven objects within the ROI are labeled. What we need to do is transform this segmented image into one containing basins. To do that, we use the distance transform.
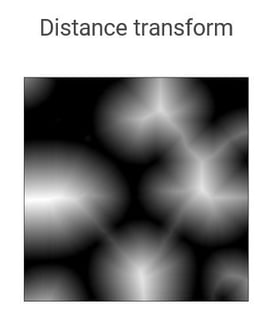
The distance transform computes the distance between each labeled void pixel and the nearest foam pixel. Below, we see the result of this calculation.
If we then plot the 3D intensity of this image, we get the result shown below. This plot shows that, rather than basins, each object corresponds to a peak. So, we need to invert the distance transform before we can perform the watershed operation.
The following image shows an inverted distance transform.
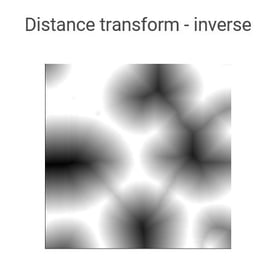
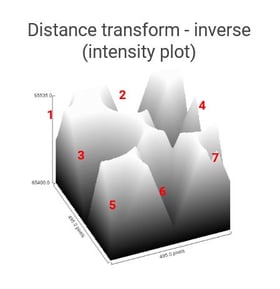
If we then plot the 3D intensity of this image, we get the result below. This plot shows each of the objects now corresponds to a basin. Now, we’re ready to perform the watershed operation.
The result of the watershed operation on the inverted distance transform is shown below. Notice that the results of the watershed are not perfect. The red circle shows where there should be a single object; however, it is divided into two parts This is called over-segmentation, which can easily be fixed by merging objects.
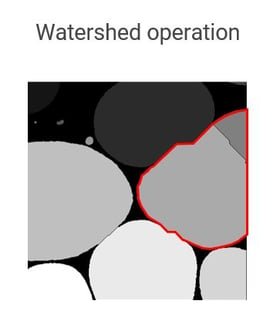
Now, you have each of the voids within the foam properly segmented and each void is assigned as an individual object.
Try some hands-on exercises
I hope this article helps you understand how to refine segmentation results. The best way to learn is to practice. All the source images you saw in this article are available to download. You can use the open-source image processing programs ImageJ, MorphoLibJ, and Classic Watershed plugins to perform the operations demonstrated here. All sample data, the tutorial video, and an e-book are available on the on-demand workshop recording page.
If you have any questions or need help finding resources about refining segmentation, our team of CT experts can help you. You can talk to one of our CT experts by clicking the “Talk to an expert” button at the top right of the page or send us a message at imaging@rigaku.com.