


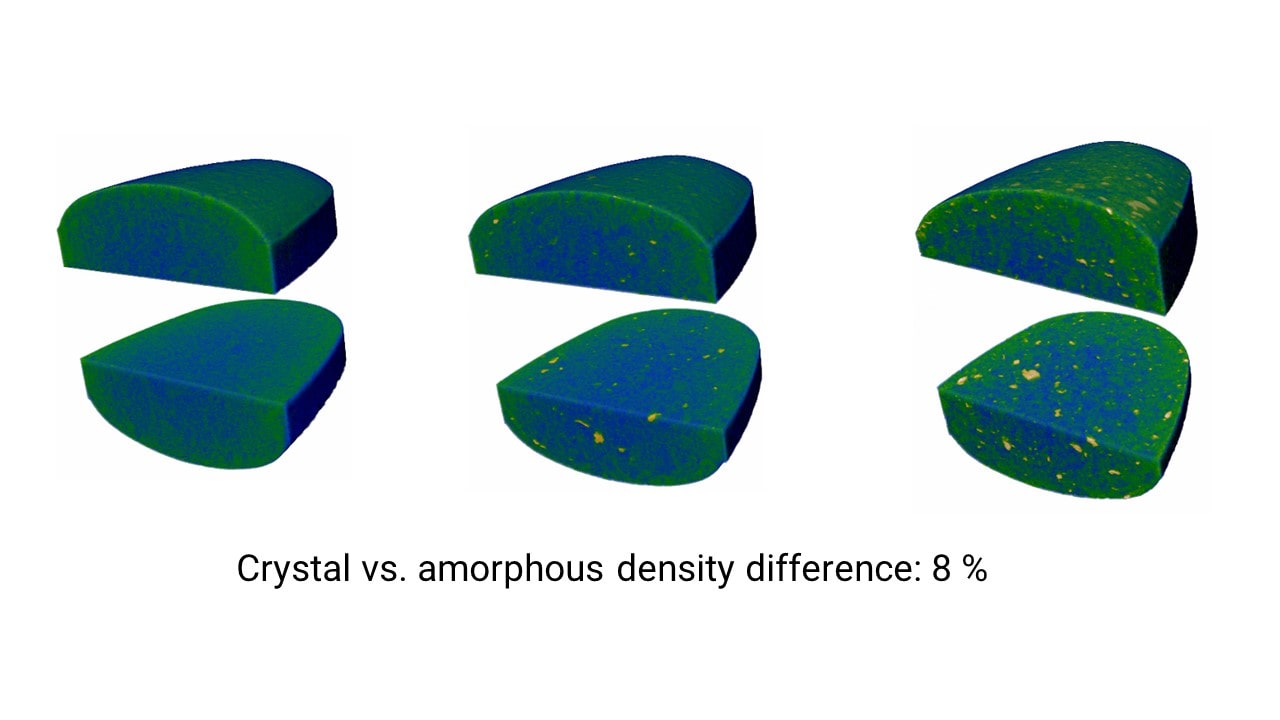
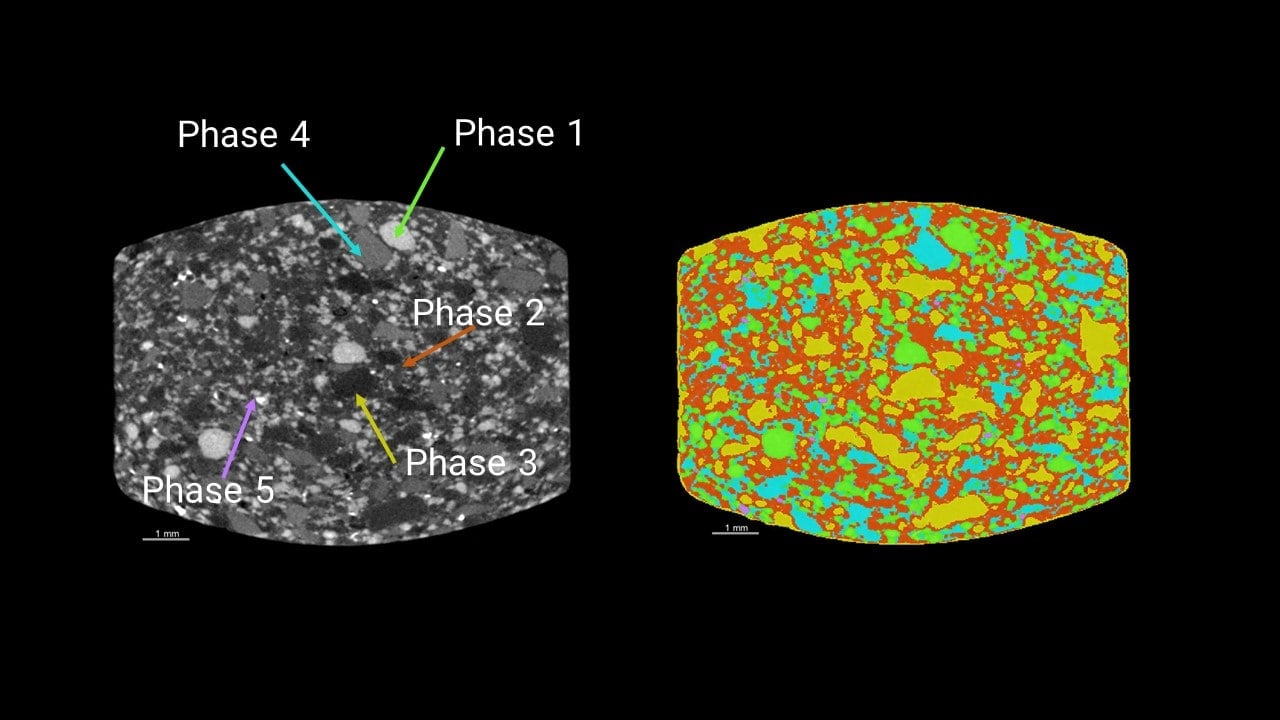
Tablet crystallinity analysis
Application Note
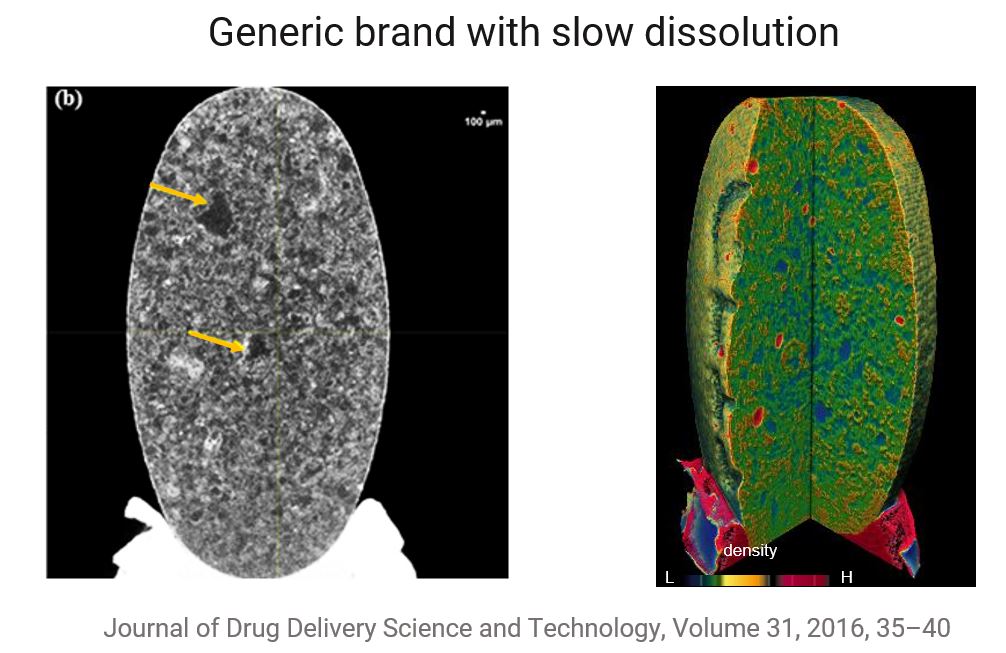
Brand name vs generic atorvastatin tablets comparison
Application Note
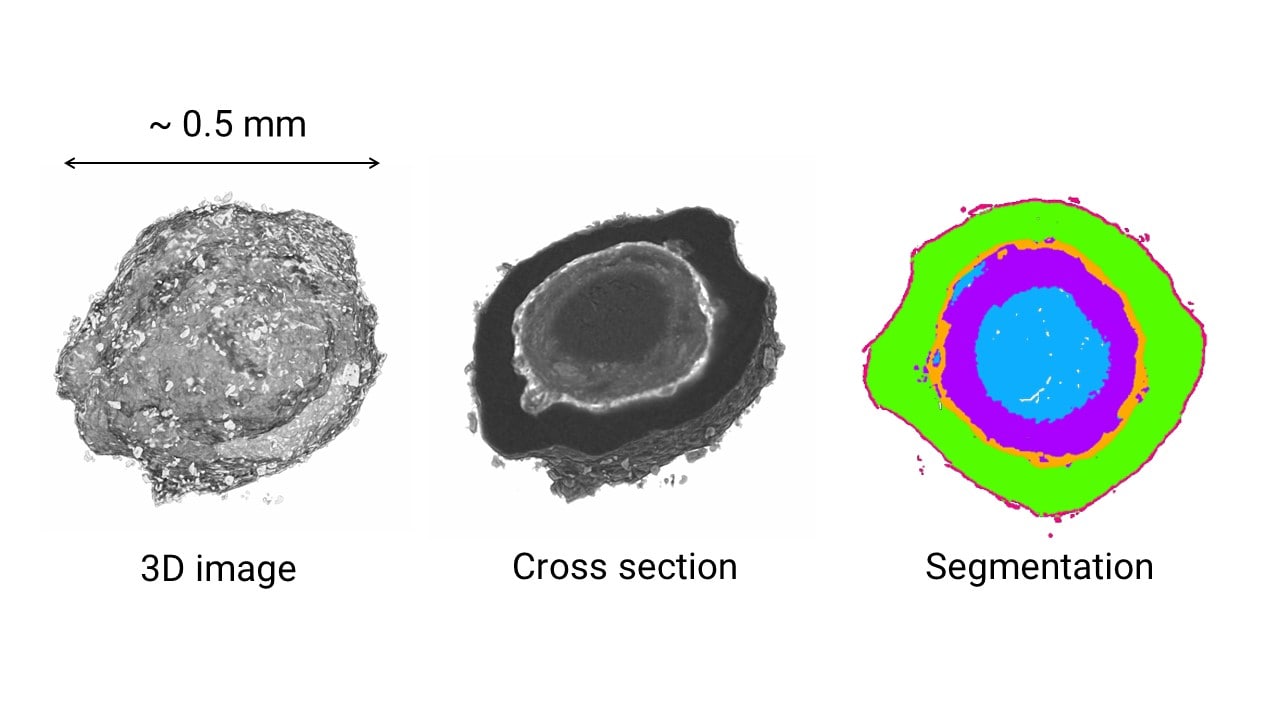
Microparticle coating analysis
Application Note
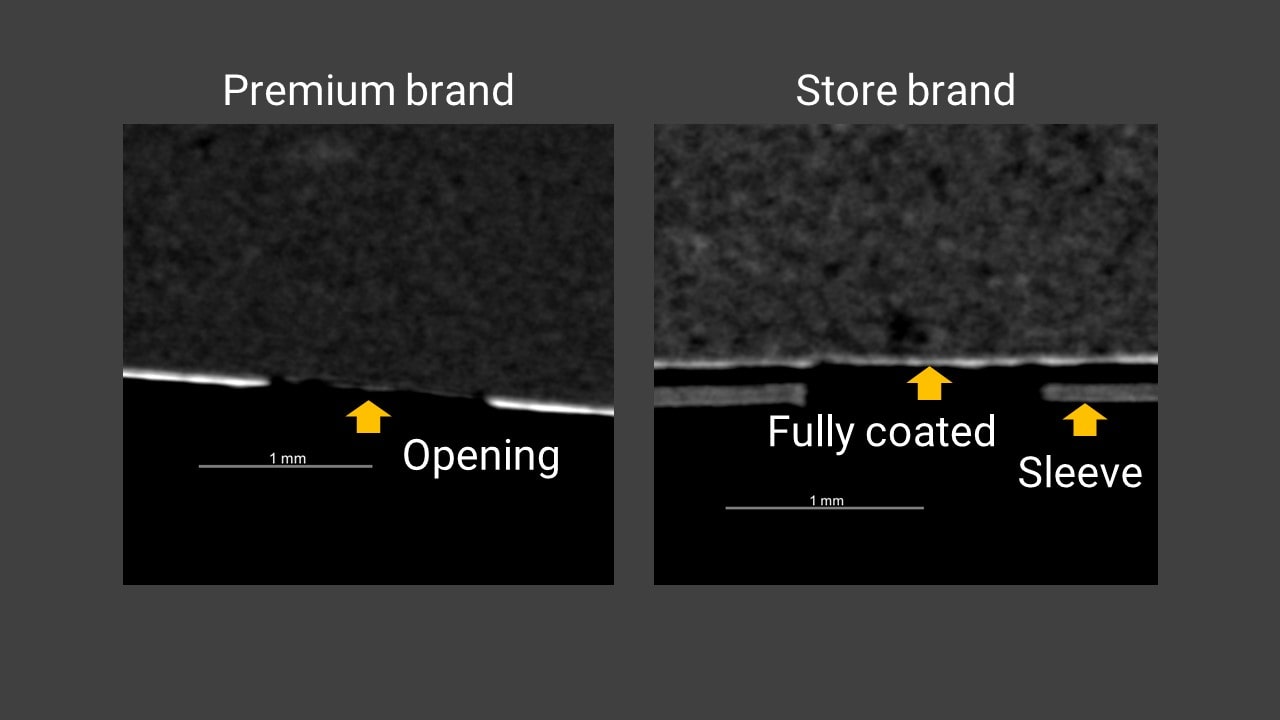
Rapid-release pain medication capsule comparison
Application Note
Multivitamin tablet analysis
Application Note
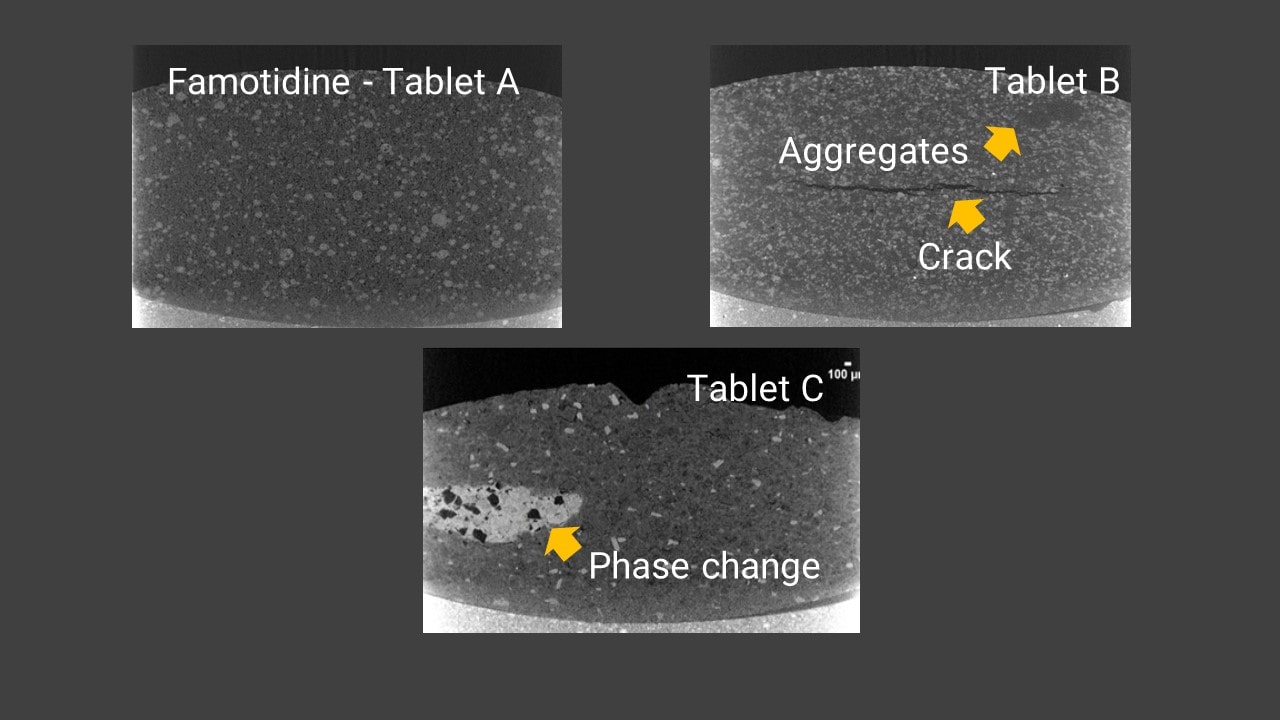
Famotidine tablet comparison
Application Note
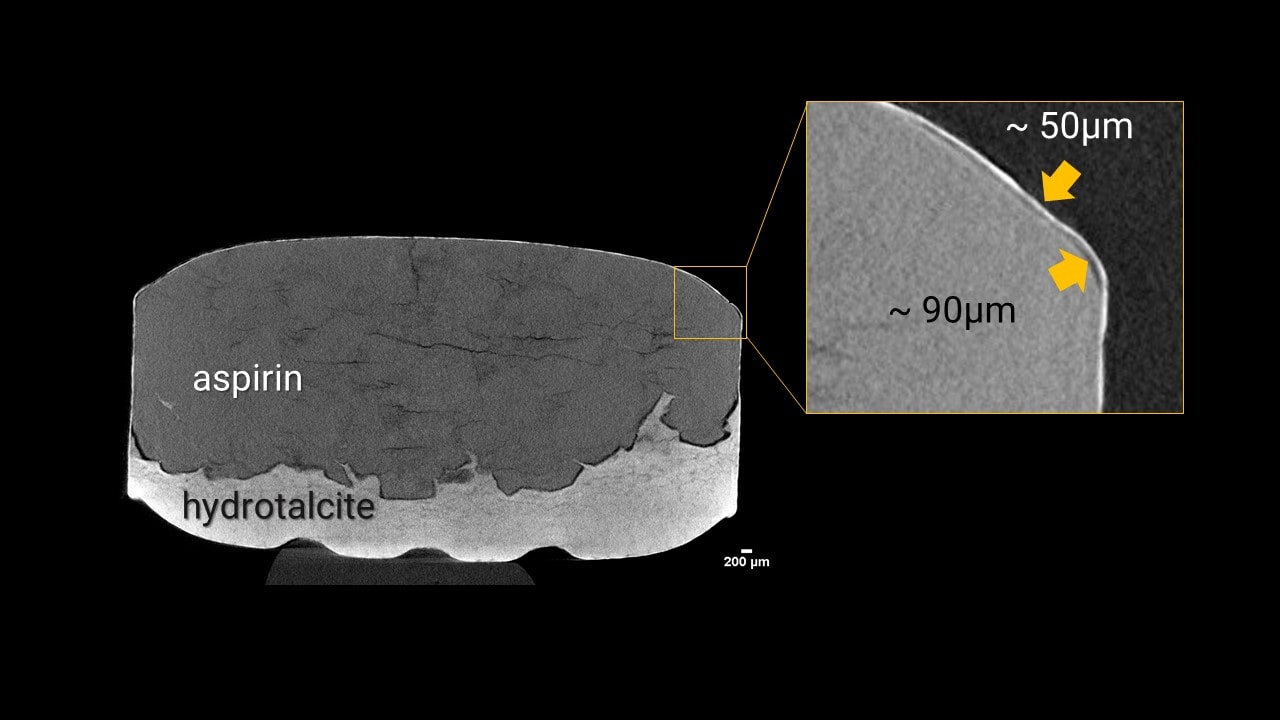
Aspirin tablet coating delamination
Application Note
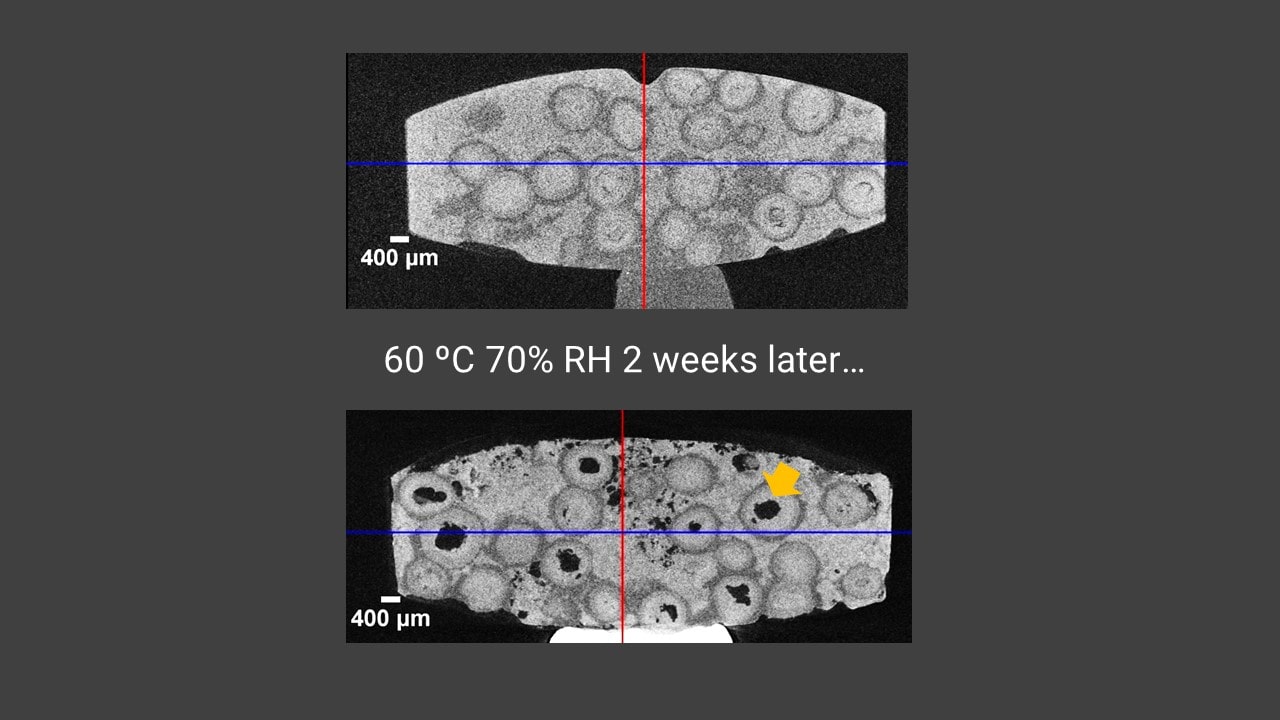
Degradation of sustained-release dosage tablet
Application Note
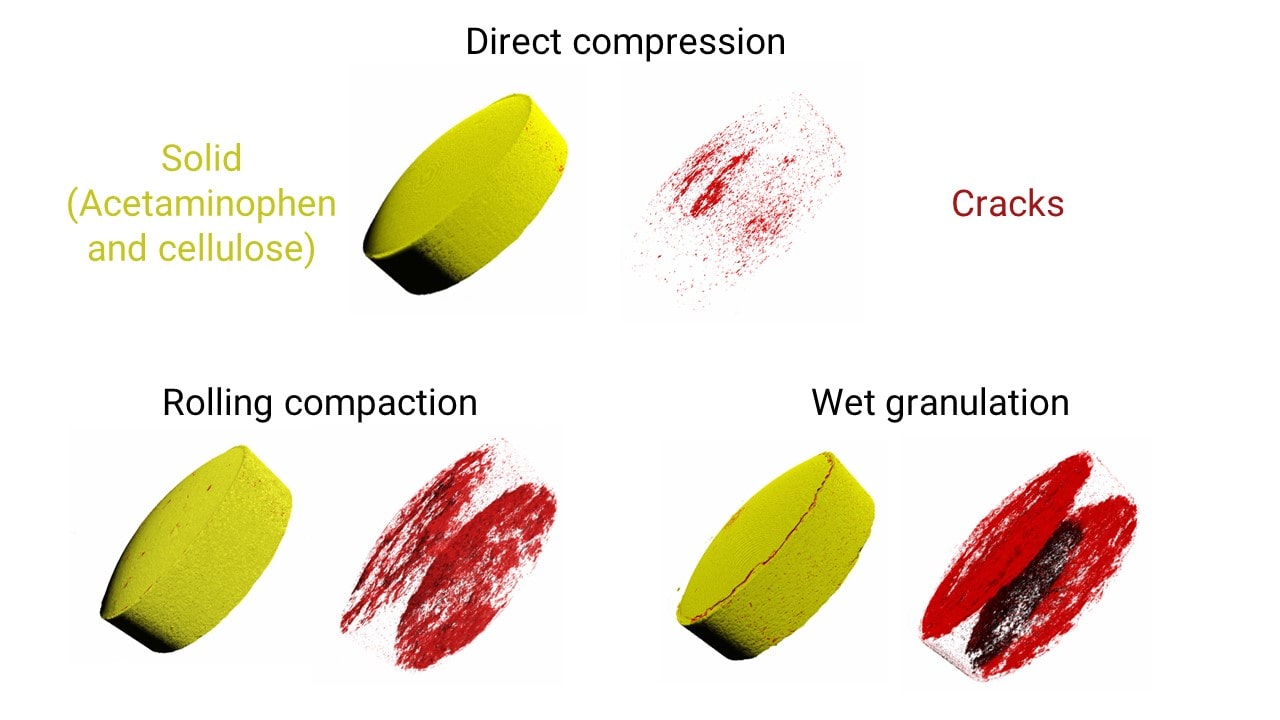
Compression methods comparison
Application Note
