MULTIVITAMIN TABLET ANALYSIS
About the sample: Multivitamin tablets
Multivitamin tablets contain essential vitamins, calcium, iron, magnesium, etc. X-ray CT (computed tomography) can visualize these components, and the CT images can be used to quantify parameters such as volume fractions, grain surface areas, and grain sizes.
Analysis procedure
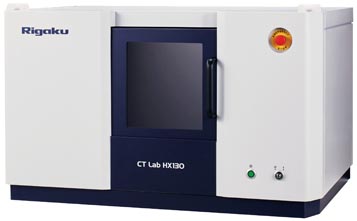
- In this example, a multivitamin tablet was scanned using a micro-CT scanner, CT Lab HX.
- The CT image was segmented using the machine learning segmentation technique.
- The volume fractions of the five components, grain surface area, and grain size distribution of two components were analyzed.
1. CT scan
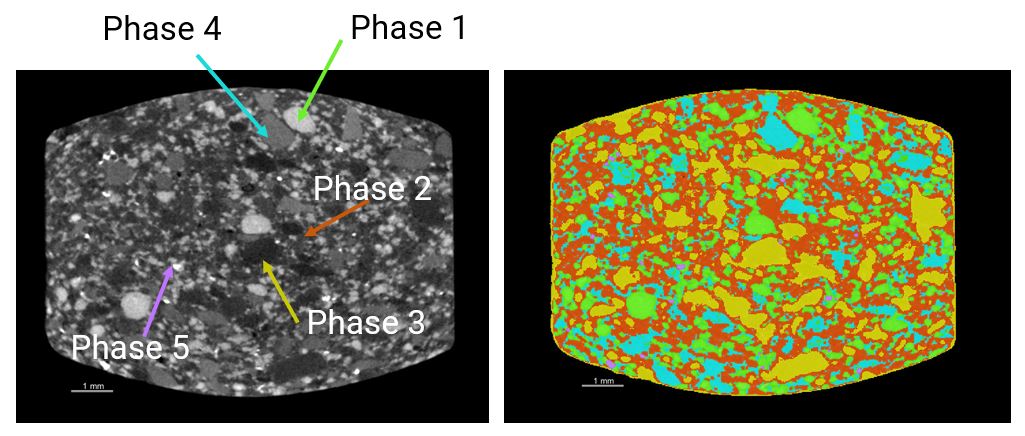
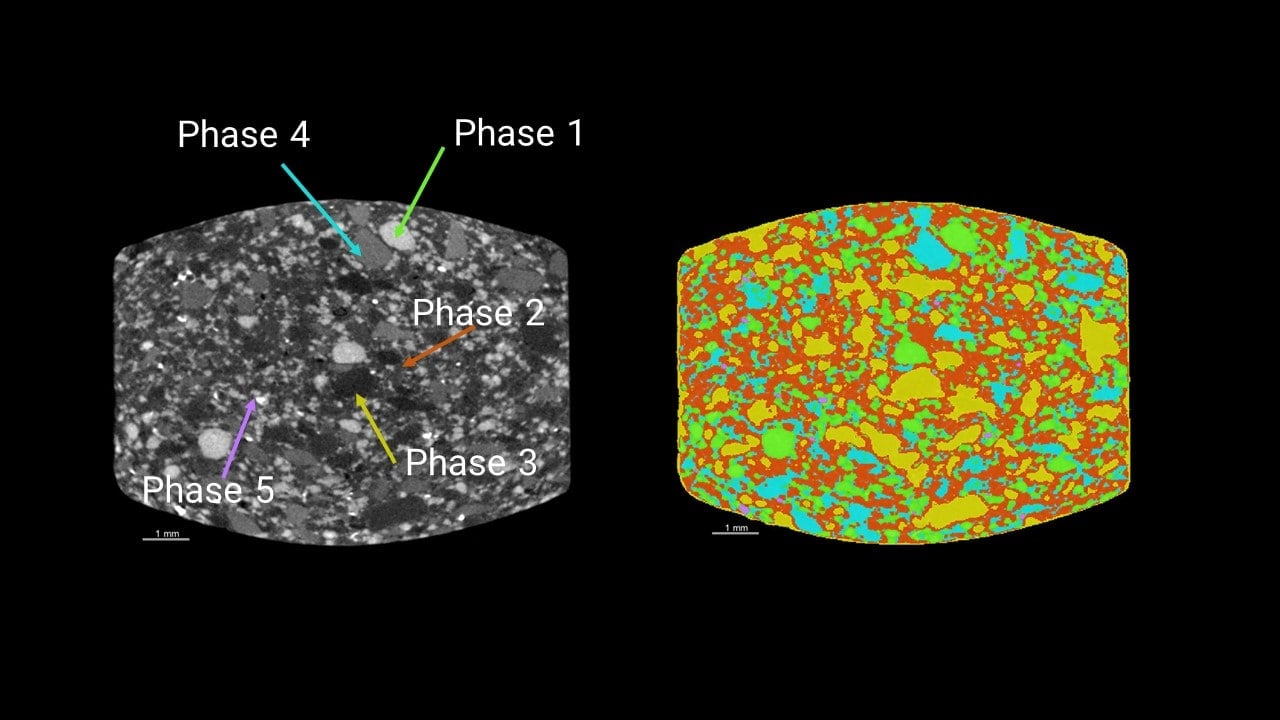
A multivitamin tablet was scanned to produce the 3D grayscale CT image. Five phases were recognized at different gray levels representing different densities.
2. Image segmentation
The CT image was segmented using the machine learning segmentation technique.
3. Quantitative analysis
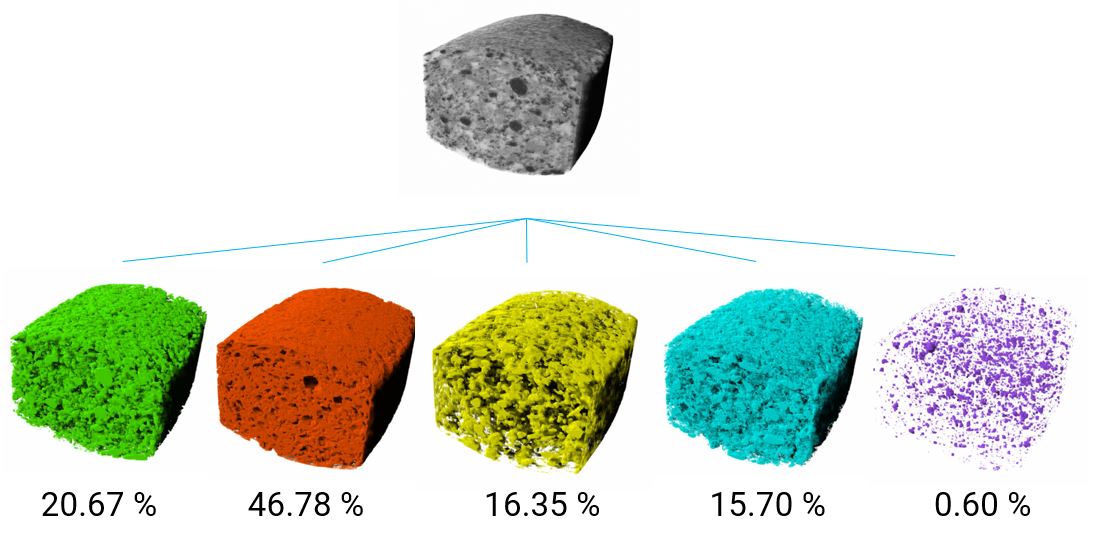
The volume fractions of the five phases were calculated from the image segmentation results.
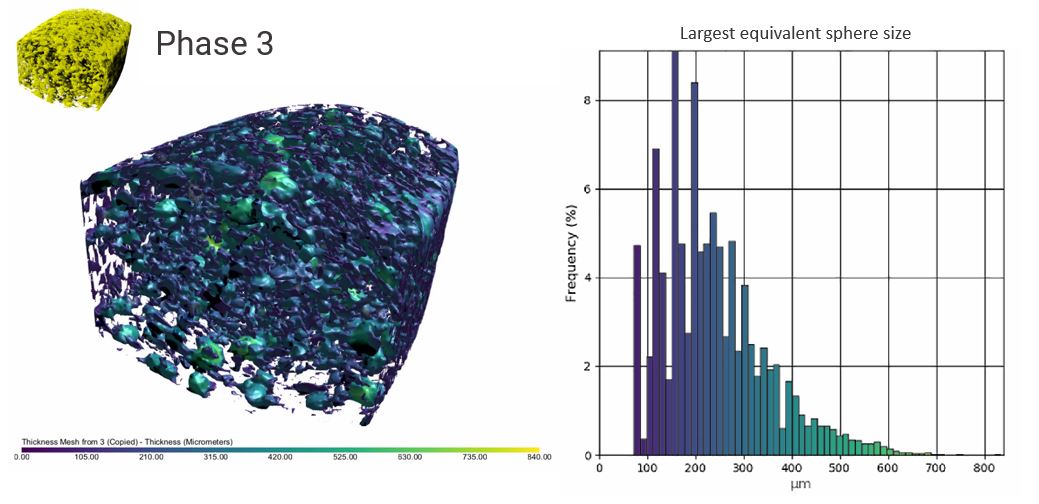
Phase 3 was further analyzed for the grain size distribution. The grain size, calculated as the diameter of a sphere that can fit within the grain, spread mainly from 100 to 400 microns, but there were several grains over 600 microns (green-yellow grains in the figure).
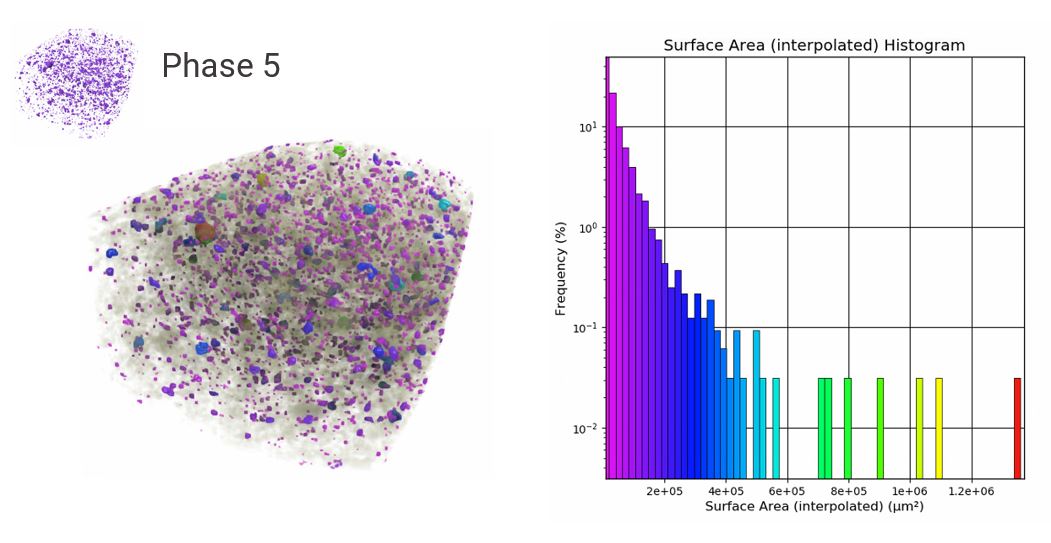
Phase 5 was further analyzed for the surface area of each grain. While most of the grains' surface area was under 4e+5 square microns, one grain over 1e+6 square microns was also found (the red grain in the figure).
More Pharmaceutical Application Examples
Watch an on-demand webinar about X-ray CT pharmaceutical applications.
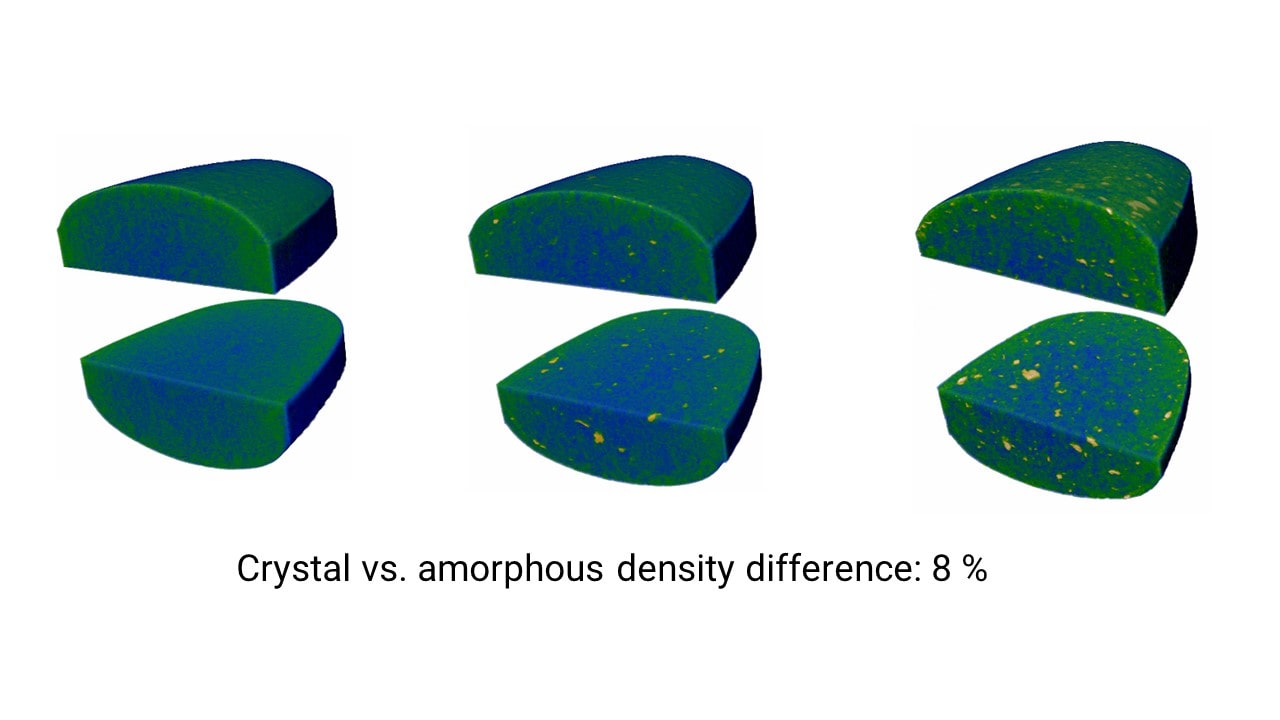
Tablet crystallinity analysis
Application Note
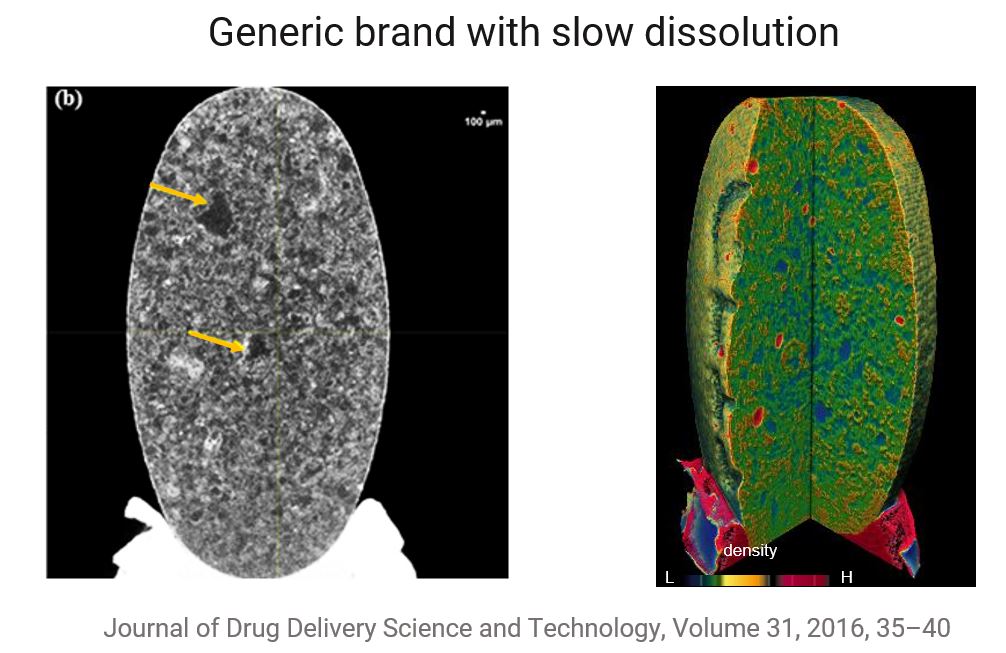
Brand name vs generic atorvastatin tablets comparison
Application Note
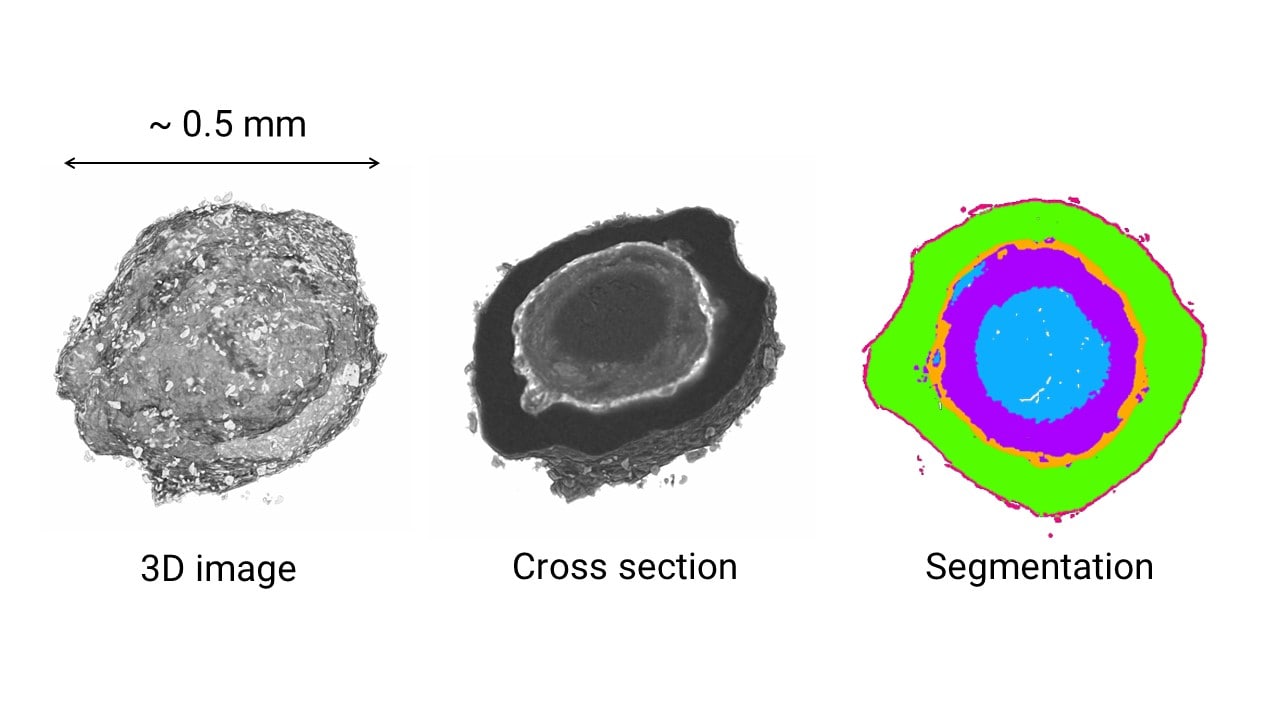
Microparticle coating analysis
Application Note
Rapid-release pain medication capsule comparison
Application Note
Multivitamin tablet analysis
Application Note
Famotidine tablet comparison
Application Note
Aspirin tablet coating delamination
Application Note
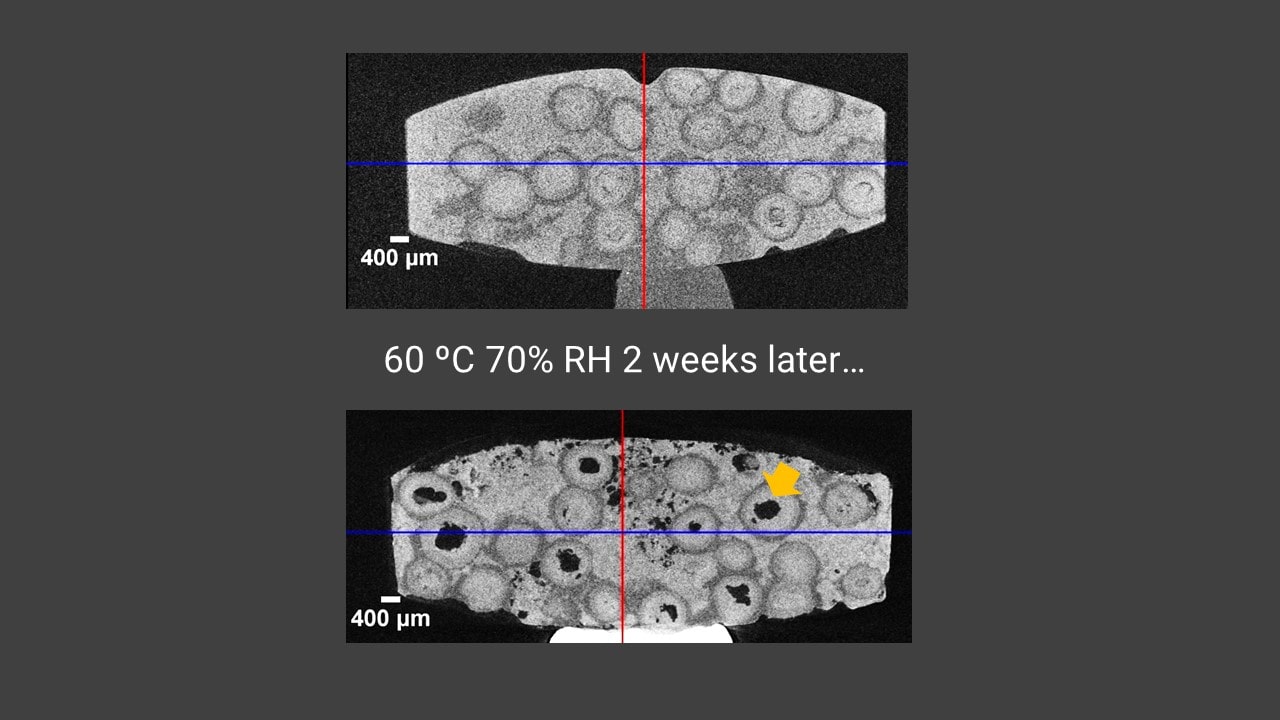
Degradation of sustained-release dosage tablet
Application Note
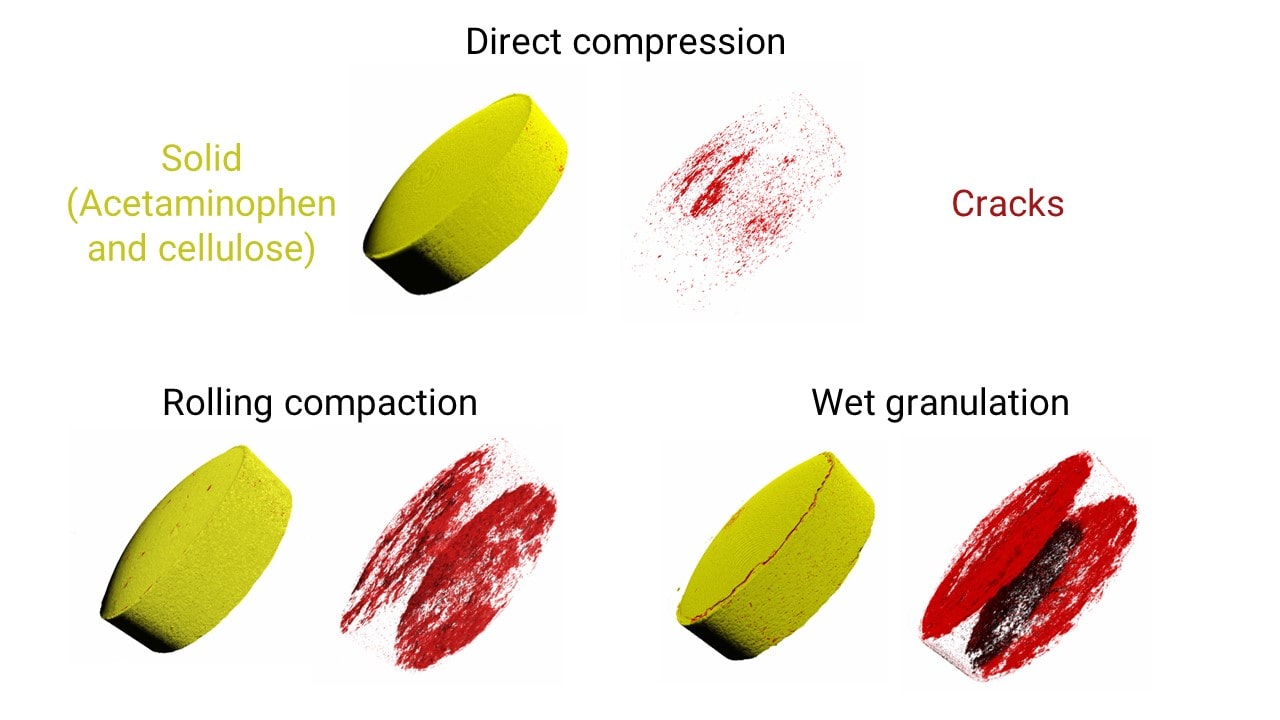
Compression methods comparison
Application Note


