


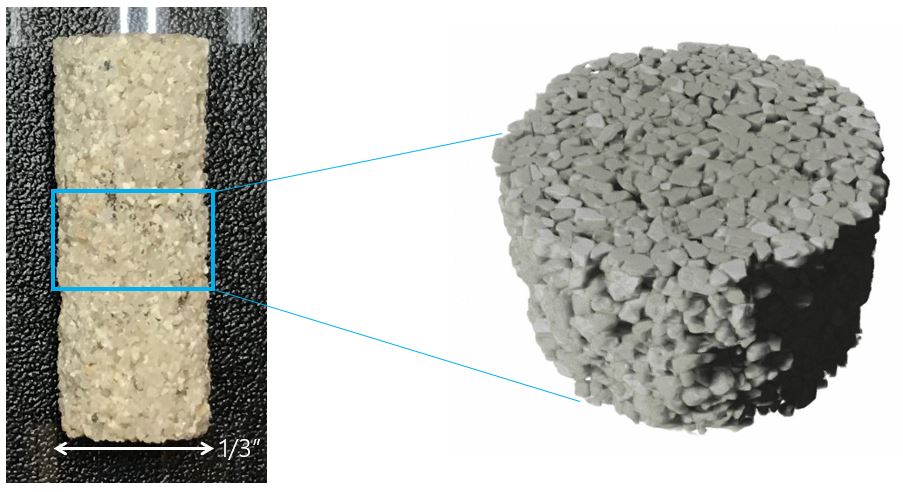
Sandstone grain size analysis
Application Note
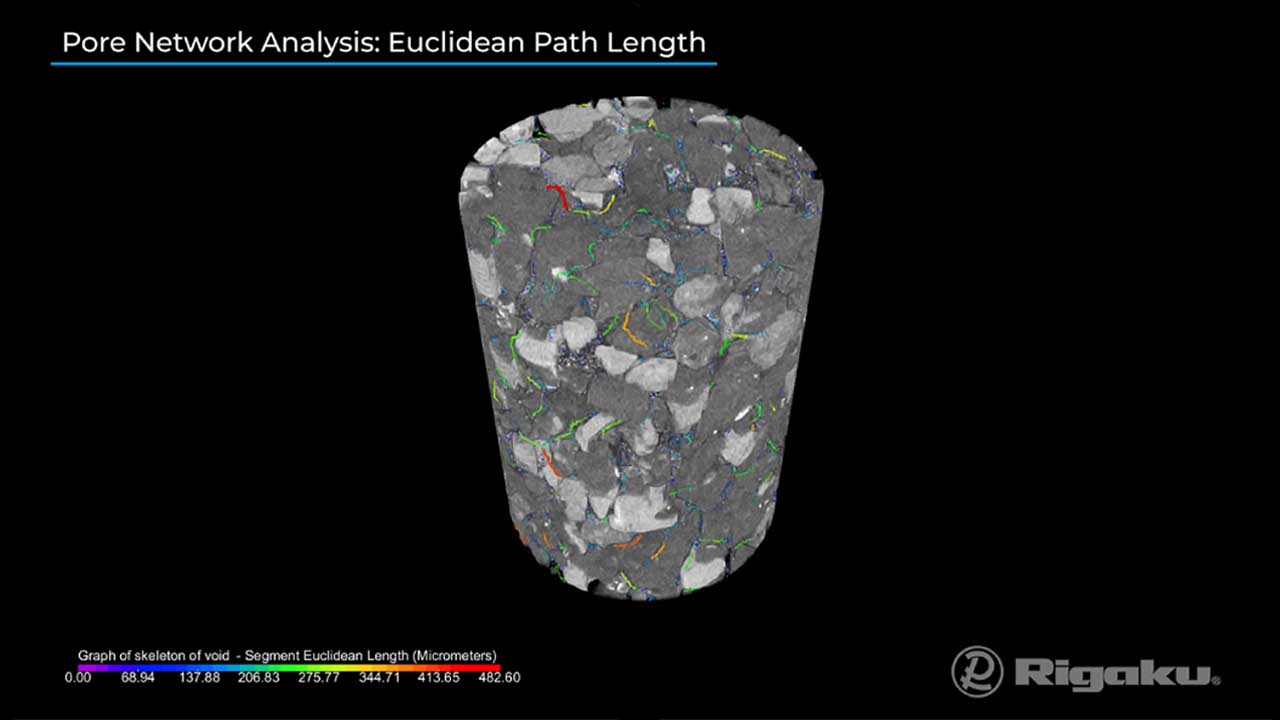
Sandstone pore network analysis
Application Note & Video
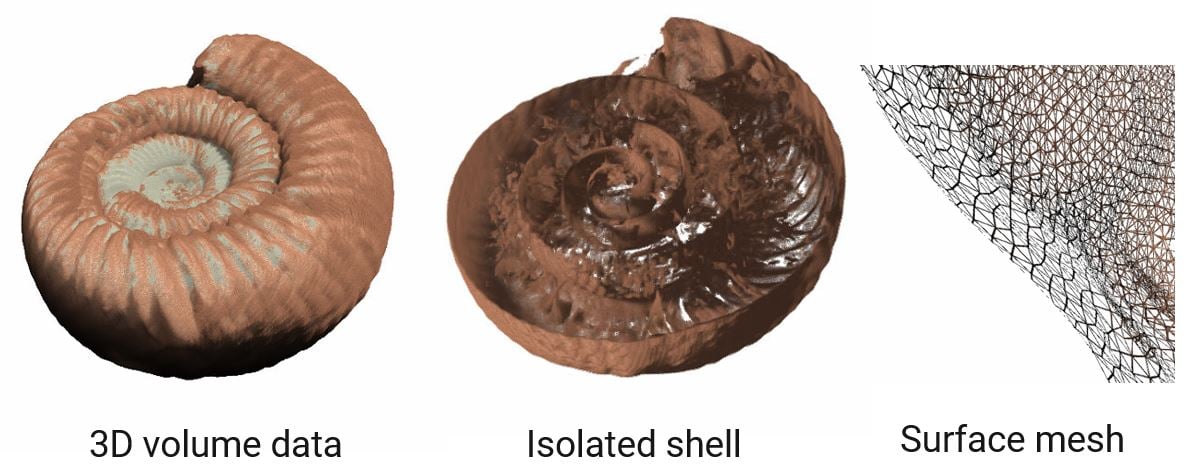
Ammonite fossil scan
Application Note
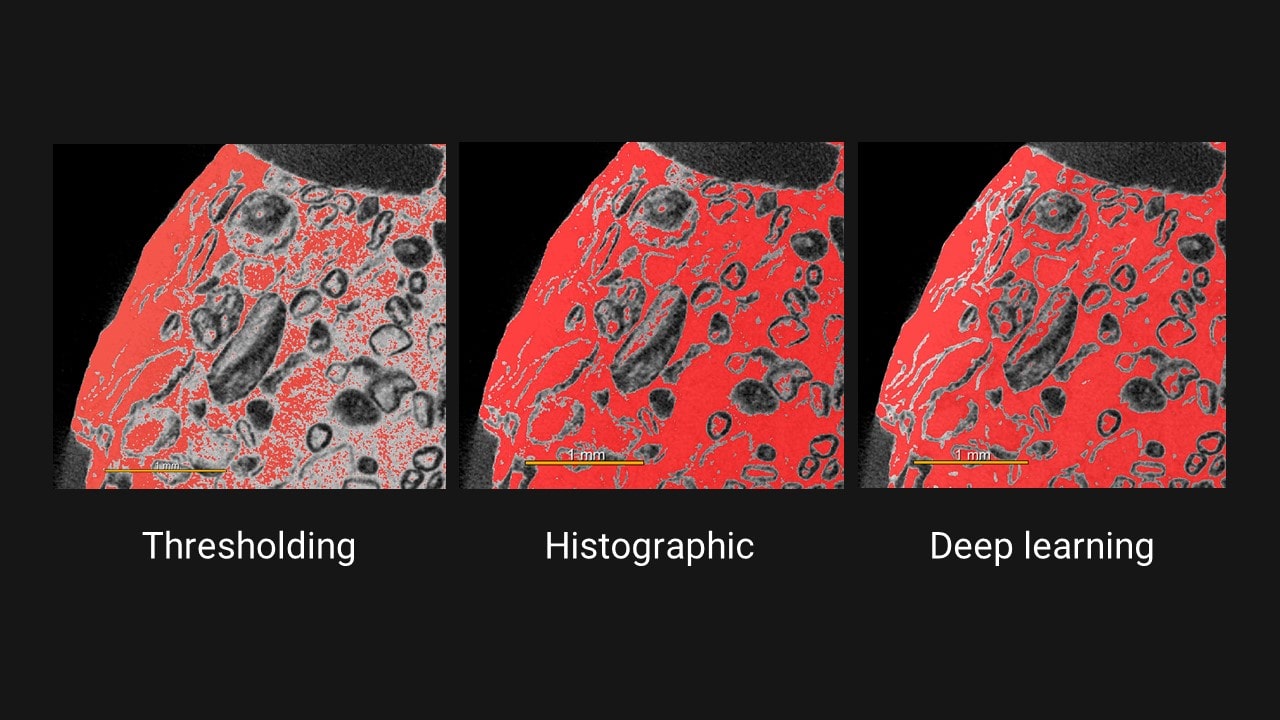
Carbonate porosity analysis segmentation comparison
Application Note
Granite phase fraction analysis
Application Note
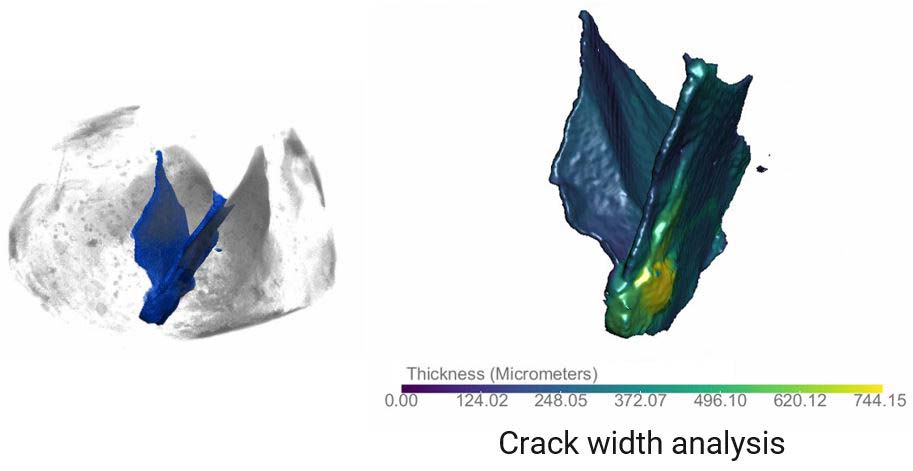
Rock crack analysis
Application Note
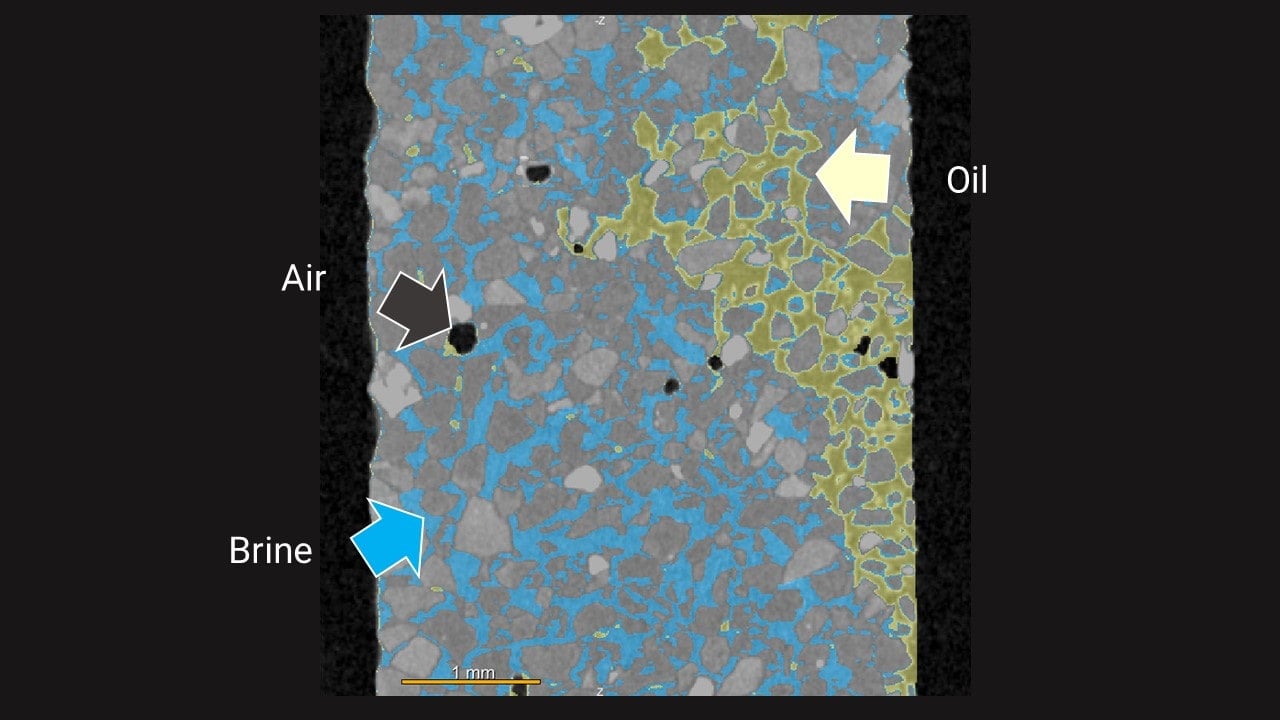
Sand oil and brine segmentation
Application Note
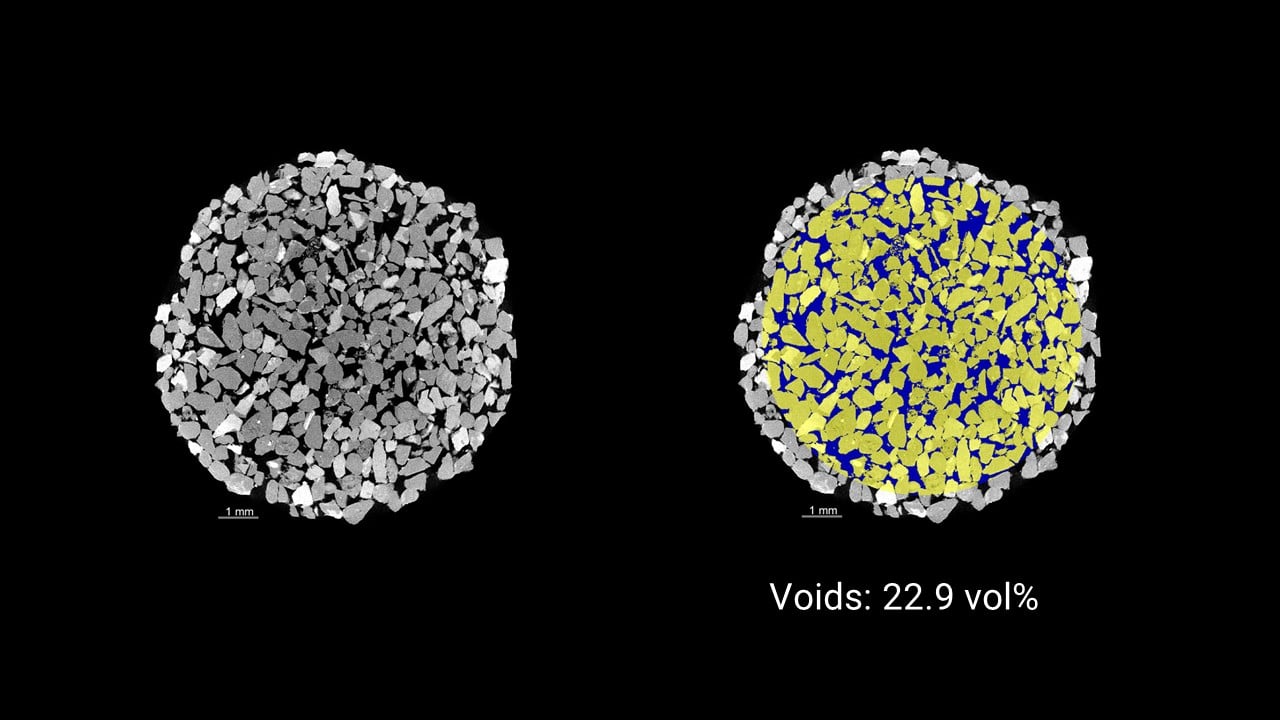
Sandstone porosity comparison
Application Note
