
Are you new to X-ray micro-CT (computed tomography)? If so, you must have many questions. Learning a new analytical technique can be overwhelming. Purchasing new equipment is a significant investment, and the equipment selection process can be even more overwhelming, especially when you don’t have experts you can talk to.
Here at Rigaku, we design, build, sell, install, and support micro-CT scanners globally. We help people choose the right scanner, and we train equipment owners on how to collect high-quality CT images and analyze them to produce quantitative insights about their research subject. So we know a thing or two about micro-CT.
We will answer the questions our customers frequently ask us about micro-CT on this page. Hopefully, you will find the answers you were looking for below. If not, please don’t hesitate to reach out to us at imaging@rigaku.com or book a meeting with one of our experts.

1. Micro-CT: What is it?
X-ray CT (computed tomography) is an X-ray imaging technique that can non-destructively image an object in 3D. It allows you to study internal structures such as pests inside a fruit, broken circuits in packaged electronics, voids and fiber distributions in composite materials, etc., without cutting the samples open.
CT is often confused with radiography, but they are different. CT data is a 3D volume, while a radiograph is a 2D projection. For example, this is a radiograph of a walnut:
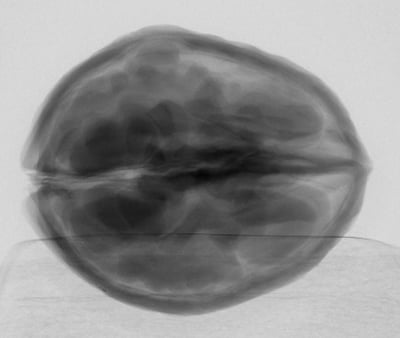
If something rather big is clearly broken, you can see it in a 2D projection. However, you can’t quite understand the details of the internal structures without getting a 3D image using CT. Here are CT images of the same walnut:
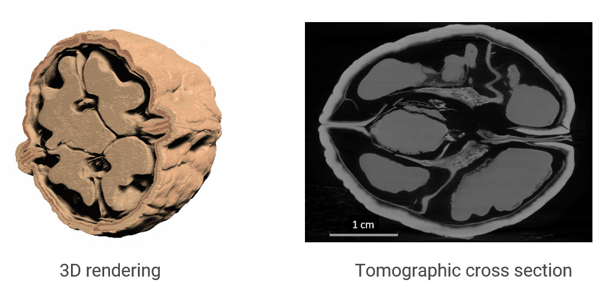
You can see the higher level of detail and increased amount of information a CT scan can provide compared to a 2D projection. CT measurements take longer than radiography and the instruments are more expensive, so they might be overkill for process control, but they are often worth it for scientific research, product development, and failure analysis.
There is a wide range of X-ray CT scanners with different resolutions, sample size limitations, and geometries. Generally speaking, CT scanners with micron resolution are called micro-CT scanners.
CT was first invented and used for medical imaging, but the technique migrated into materials research and industrial inspection over the years. This primarily involved invention of different types of X-ray sources and detectors.
More recent technological advancements are on the computation side. Reconstruction calculations used to convert 2D projections into a 3D volume became faster and more sophisticated, to generate higher-quality CT images.
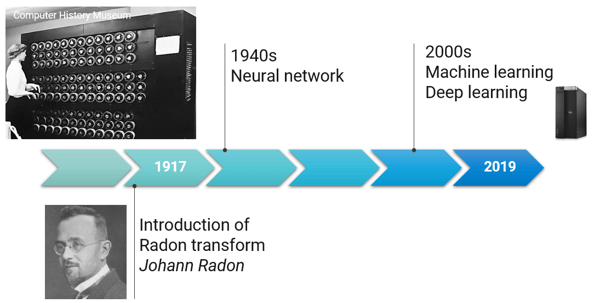
Advancements in computational power in general and the rise of artificial intelligence (AI) based image analysis have enabled more detailed and accurate quantitative analyses of CT images in the last ten years.
The concept of neural networks first appeared in the early 1940s. Eighty years later, AI-based image analysis, such as machine learning and deep learning image segmentation, has become an everyday tool we use to analyze CT images.
3. How micro-CT works
A CT image is a 3D map of a material’s absorption rate closely related to its density. We cannot measure the 3D map directly; instead, we need to measure 2D projections and reconstruct the 3D map.
An object absorbs X-rays at a varying rate depending on the material’s absorption rate for transmitting X-rays’ energy. Given the same X-ray energy, the denser the material is, in general, the more X-rays are absorbed. Also, the thicker the object is, the more X-rays are absorbed.
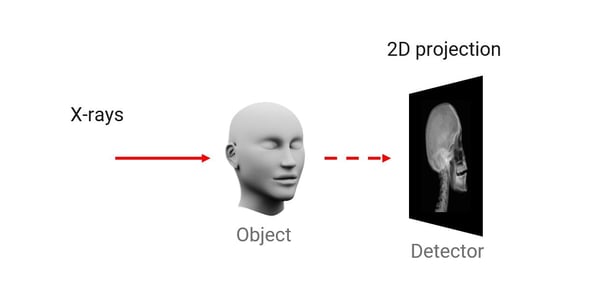
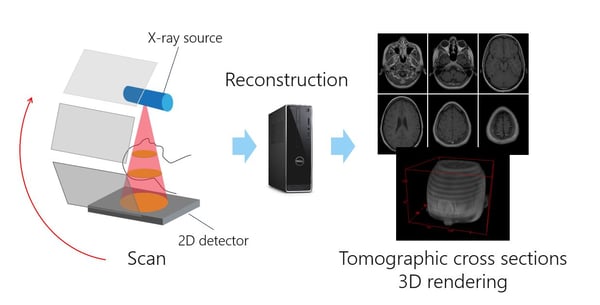
By putting an X-ray source on one side of the object and a 2D detector on the other, we can capture a 2D projection showing varying levels of X-ray absorption.
You can rotate the object and obtain multiple 2D projections. Alternatively, you can rotate the X-ray source and the detector around the object. The former is more common for micro-CT, especially when high resolution is required. The latter is more common for medical CT to avoid rotating the patient.
The figure below shows an example of a head CT scan. After a scan is complete, you can put the obtained 2D projections into a reconstruction program to "reconstruct" the 3D image.
5. Micro-CT application examples
X-ray CT can be useful if you need to image the internal structure of something non-destructively. The application of micro-CT spans a wide range, even outside medical use.
Here are several representative examples.
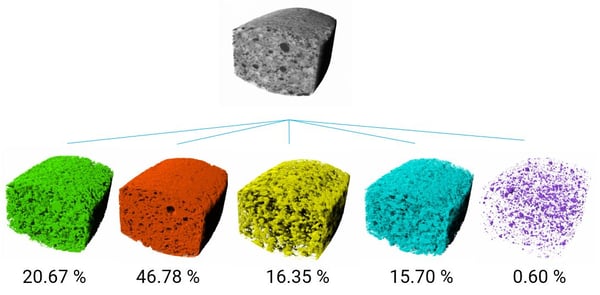
Phase volume fraction analysis
Different phases often show different gray levels in CT images due to their different absorption rates. That means that you can analyze the volume fraction.
Here is an example of a volume fraction analysis of a multivitamin tablet.
This analysis can also be applied to composites, geological samples, food, or any mixture of different materials. Void fraction calculations are just one of the most common applications. Below is an example of solder joining void analysis.

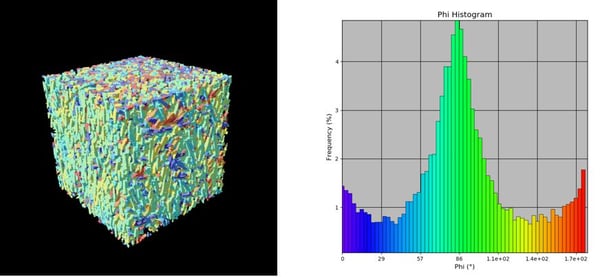
Particle, pore, and fiber analysis
Particles, pores, and fibers can be segmented in CT images, and their properties can be investigated. For example, you can analyze particle size distribution in pharmaceutical tablets, pore networks in reservoir rocks, pore size distribution in foams, or the orientation of fibers in composites.
Below is an example of orientation analysis of carbon fibers in CFRP (carbon fiber reinforced polymer).
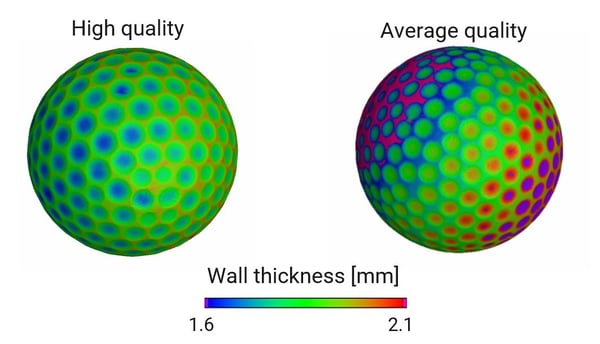
Coating and wall thickness analysis
Coatings and walls, including those inside an enclosed object, can be imaged using CT. They can be segmented and their thickness distributions and any discontinuity or delamination can be identified.
Below are the analysis results of the wall thickness distribution of two grades of golf balls.
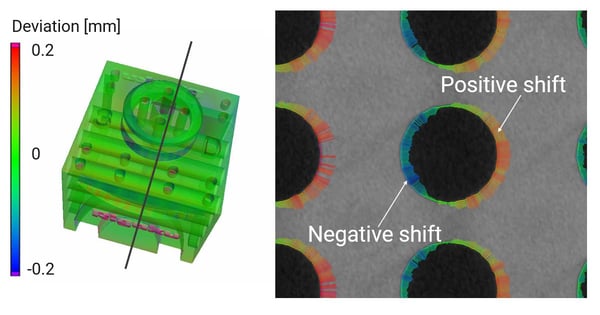
Metrology and dimensional analysis
CMMs (coordinate measuring machines) and optical scanners are often used to analyze the dimensions of parts. While these techniques cannot reach the internal structures, CT can image the entire volume of the parts and enable internal dimensional analyses.
Below is an example of an actual (CT scan) and nominal (CAD) dimensional comparison of a 3D-printed plastic part.
Non-destructive 3D imaging
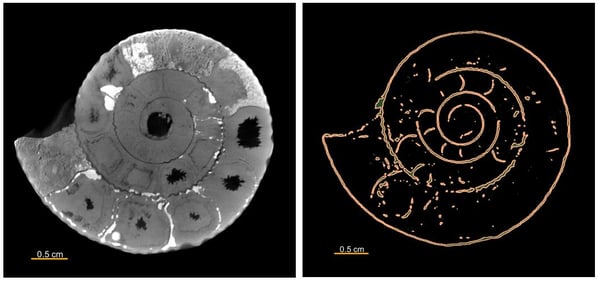
As we saw in the examples above, CT images are segmented, and properties and dimensions of interest are quantitatively analyzed. However, inspection of 3D images can tell us a lot. CT is used in archeology and other areas where people need to see the internal structures of rare or valuable samples that need to stay intact.
Below is an example of the internal structure of an ammonite fossil revealed by a CT scan.
12. How to analyze micro-CT data
The way we analyze CT data differs depending on whether we use CT for materials research or dimensional analysis.
For materials research, we segment the CT images by labeling individual voxels as polymer, void, and carbon fiber, for example. Meanwhile, for dimensional analysis, we need to use a method called ISO-50 surface determination to identify the object’s surface location with a resolution beyond the voxel resolution.
As you see in the overview below, image segmentation is the first step of the analysis process for materials research. You can segment the CT images into different phases by thresholding the gray levels. When thresholding fails due to noise and low contrast, etc., you can use machine or deep learning segmentation.
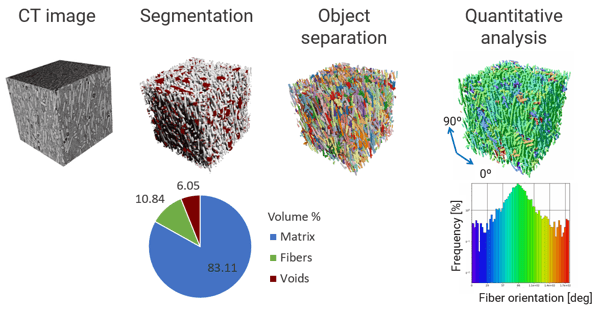
Once you segment the image, you can calculate the volume fractions.
Then, individual objects—fibers, for example—need to be separated before analyzing properties such as fiber orientation and particle size distributions.
To analyze dimensions, you start with surface determination using the ISO-50 method, as you see in the outline below:
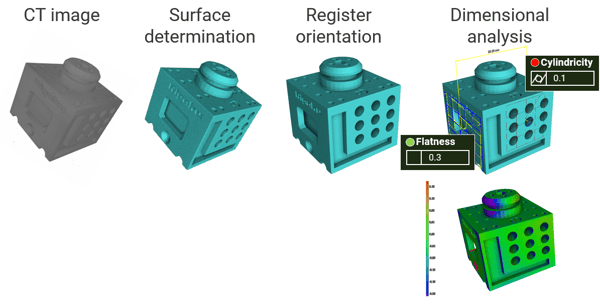
Once the surface is determined, you can orient the part to align it to the measuring coordinate axes. Then you can start measuring dimensions, evaluating geometrical tolerances (GD&T analysis: geometric dimensioning and tolerancing analysis), or comparing the actual (CT) to the nominal (CAD) dimensions.
Many commercial software packages are available. We will review them in the next section.
We hope this article helped to answer your questions. At Rigaku, we have been designing and building X-ray instruments for over 70 years. Our team of sales and application specialists can help you find and configure the right CT scanner for your research. You can also try CT scans on your samples and schedule a demo.
If you have questions or are interested in testing one of our CT scanners, you can email us at imaging@rigaku.com or book a meeting with one of our experts.