Microparticle Coating Analysis by X-ray CT
About the sample: Microparticle
Microparticles are one of the drug delivery systems and can protect the encapsulated active agent against degradation, accurately control the release rate of the incorporated drug, and be administered easily (Singh et. al, (2010) Res Pharm Sci., 5(2), 65-77). Because the coatings on the microparticles control where, when, and how fast the active agent dissolves and is absorbed by the human body, it is important to characterize and control them. X-ray CT (computed tomography) is non-destructive and has sufficient resolution to resolve these coating layers. It is a perfect technique for this type of characterization. By segmenting the X-ray CT images, the coating thickness distribution can be quantitatively analyzed.
Analysis procedure
- In this example, a microparticle was taken from a tablet and scanned using a submicron-resolution CT scanner, nano3DX.
- The CT image was segmented into five phases using the deep learning segmentation technique.
- The coating thickness distribution was calculated for one of the coatings.
1. CT scan
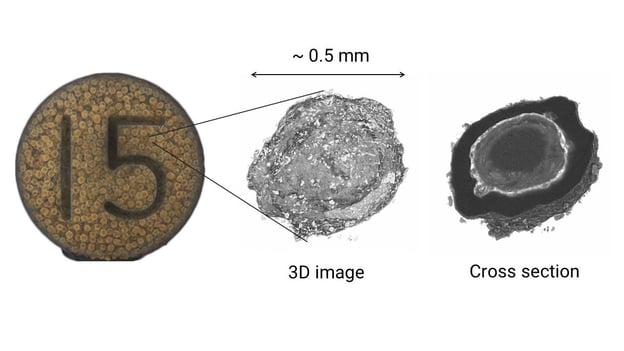
The whole tablet was scanned first (left). Then a half-millimeter size particle was taken out of the tablet and scanned to produce the submicron-resolution 3D grayscale CT image. The cross-section shows multiple layers of coating around the active agent at the core.
2. Image segmentation
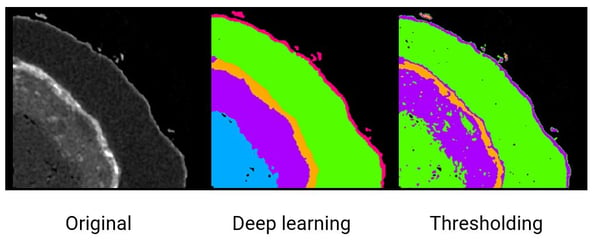
The gray level in CT data (left) represents the relative density. Four layers are recognized around the active agent core. Although the CT data show good contrast and resolution, this is not an easy image to segment because (1) some of the inner lighter shade coatings have a non-uniform texture, and (2) more than one layers have very similar gray levels.
The result of gray-level thresholding is shown on the right. It fails to distinguish the core and outer thick layer (green), or the inner thick layer and outer thin layer (purple). There are also some purple areas mixed in green due to noise and voids. All of those problems disappear and five phases plus air (black) can be cleanly segmented by using deep learning segmentation (middle).
3. Coating thickness distribution analysis
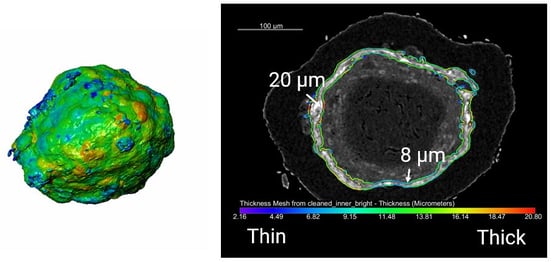
From the segmentation results, the coating thickness was calculated for the thin inner layer. The thickness varies from a few (purple) microns to 20 microns (red), and some discontinuity of the coating is also observed.
Contact Us
Whether you're interested in getting a quote, want a demo, need technical support, or simply have a question, we're here to help.