Famotidine Tablet Comparison by X-ray CT
About the sample: Famotidine tablets
Famotidine can help reduce the amount of acid the stomach produces. It is often mixed with matrices for sustained release and other fillers. The grain size of each component and morphology of the mixture are important characteristics of a tablet that can influence the release profile. X-ray CT (computed tomography) can visualize the mixture inside of tablets non-destructively to identify cracks, non-uniformity, aggregates, and phase change.
Analysis procedure
- In this example, four famotidine tablets were scanned using a submicron-resolution CT scanner, nano3DX.
- The CT images were examined for their mixture uniformity.
- Two tablets without cracks and phase change were analyzed for famotidine grain size distribution.
1. CT scan
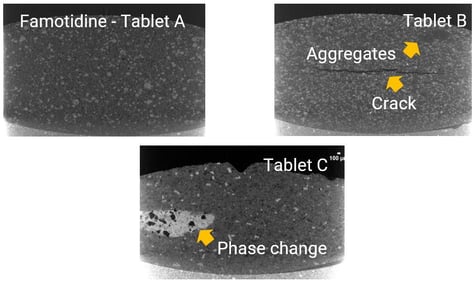
Four famotidine tablets were scanned to produce the 3D grayscale CT image. Three distinctively different cross-sections are shown in the figure.
2. Image comparison
The gray level in CT data represents the relative density. Famotidine appears in light gray. While tablet A shows a uniform mixture, tablet B exhibits matrix aggregates and crack, and tablet C shows a massive phase change.
3. Grain size analysis
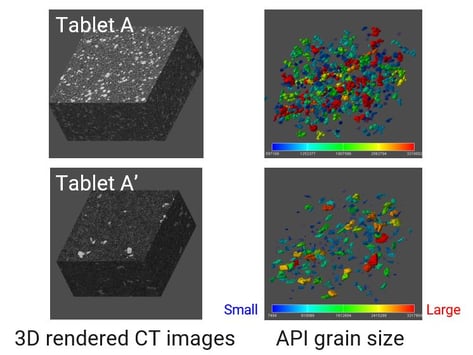
After gray-level thresholding segmentation, the famotidine (API: active pharmaceutical ingredient) grain size distribution was analyzed in two tablets without cracks and phase change, tablets A and A'. While tablet A shows relatively uniform size distribution, tablet A' shows non-uniform size distribution.
Contact Us
Whether you're interested in getting a quote, want a demo, need technical support, or simply have a question, we're here to help.