


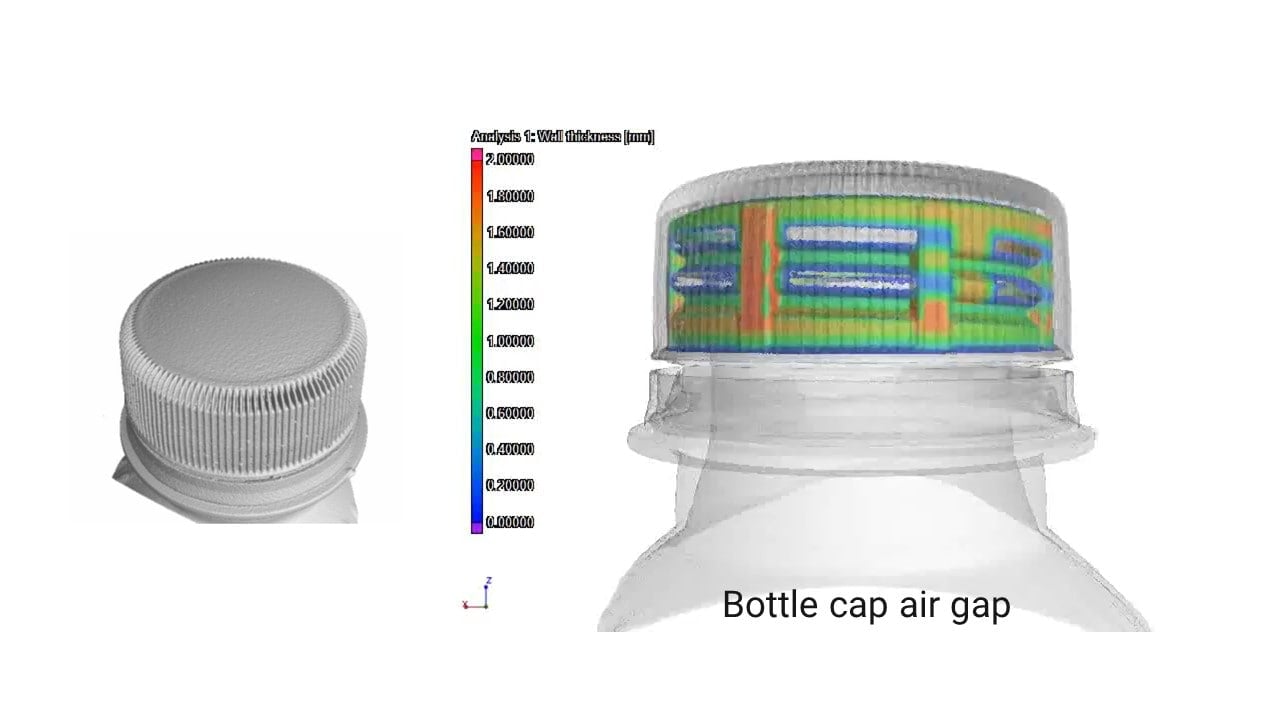
Bottlecap air gap analysis
Application Note
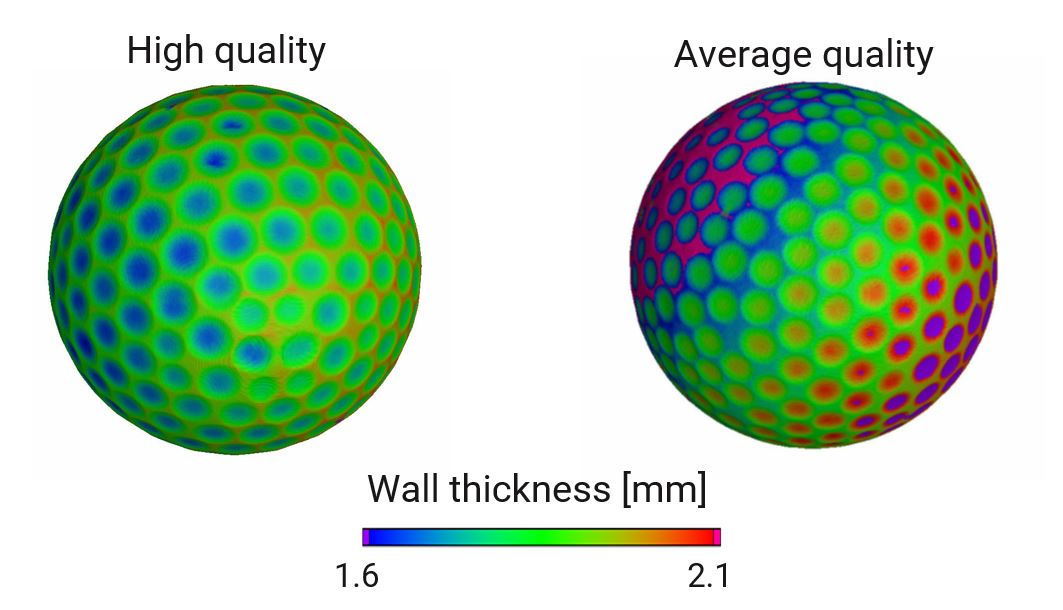
Golf ball layer thickness analysis
Application Note
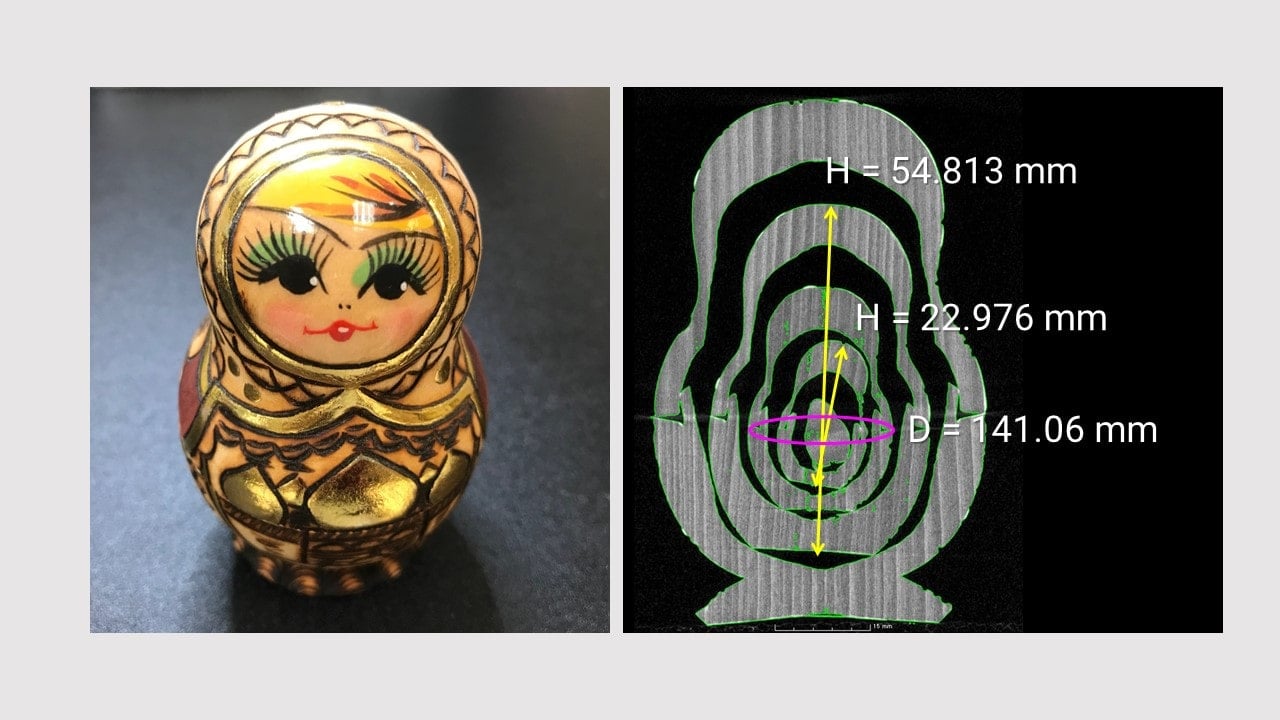
Nesting doll dimensional analysis
Application Note
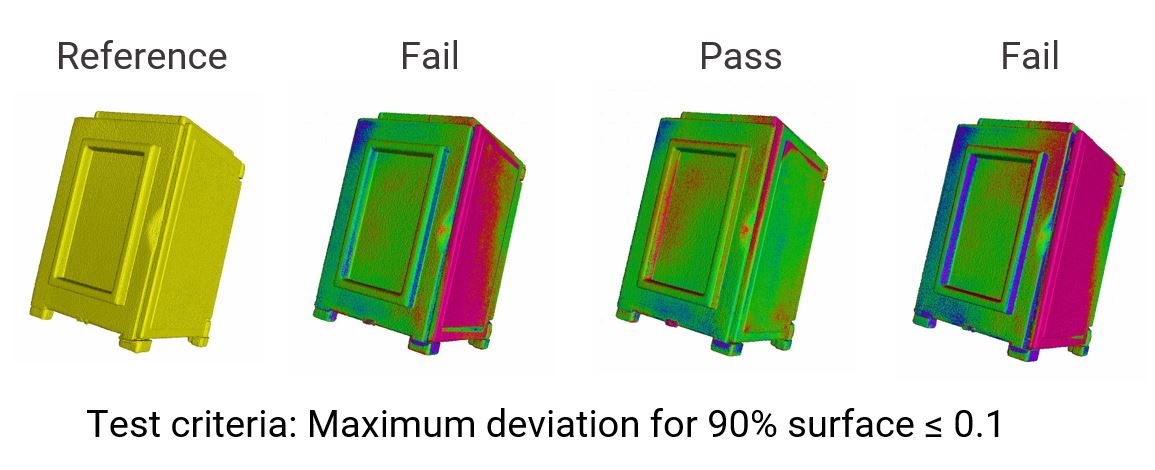
Plastic parts quality control and reverse engineering
Application Note
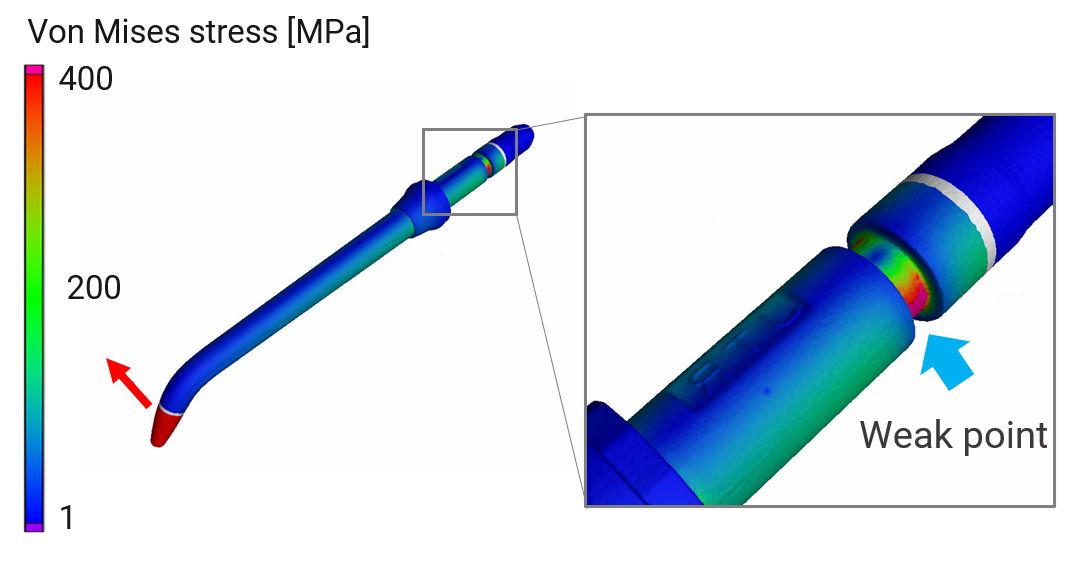
Water flosser tip stress simulation
Application Note
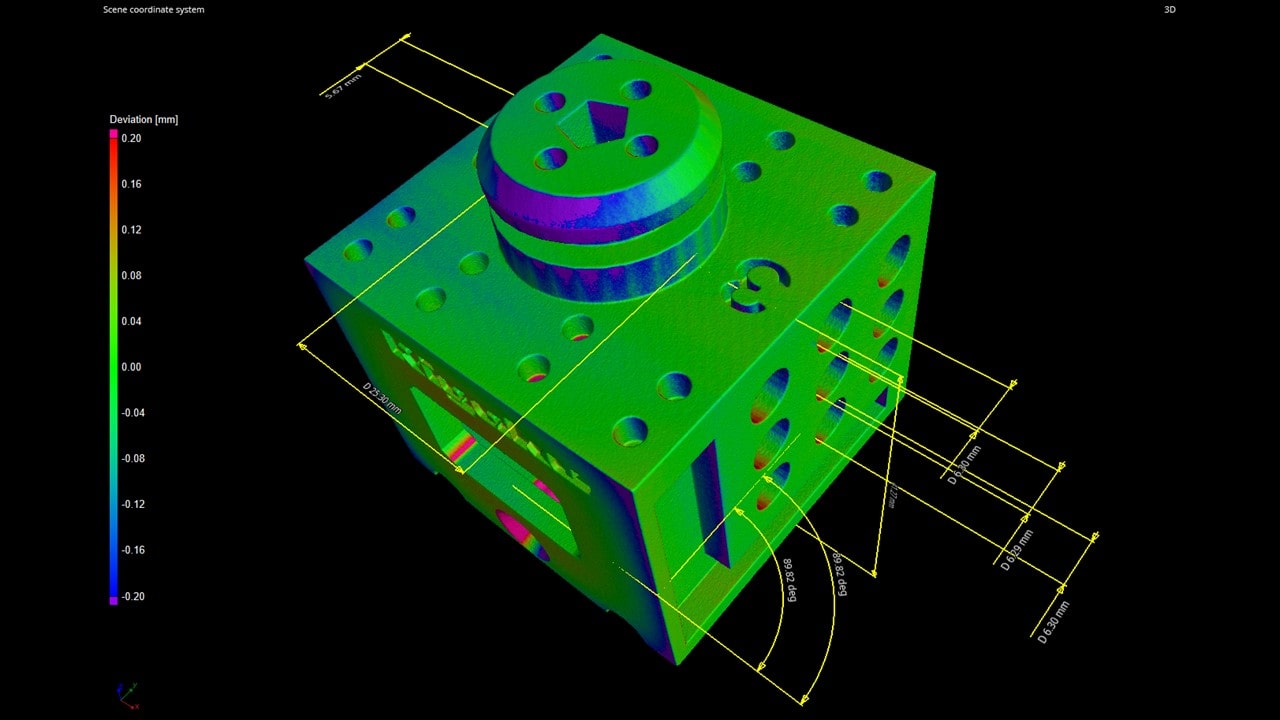
3D printed plastic dimensional analysis
Application Note
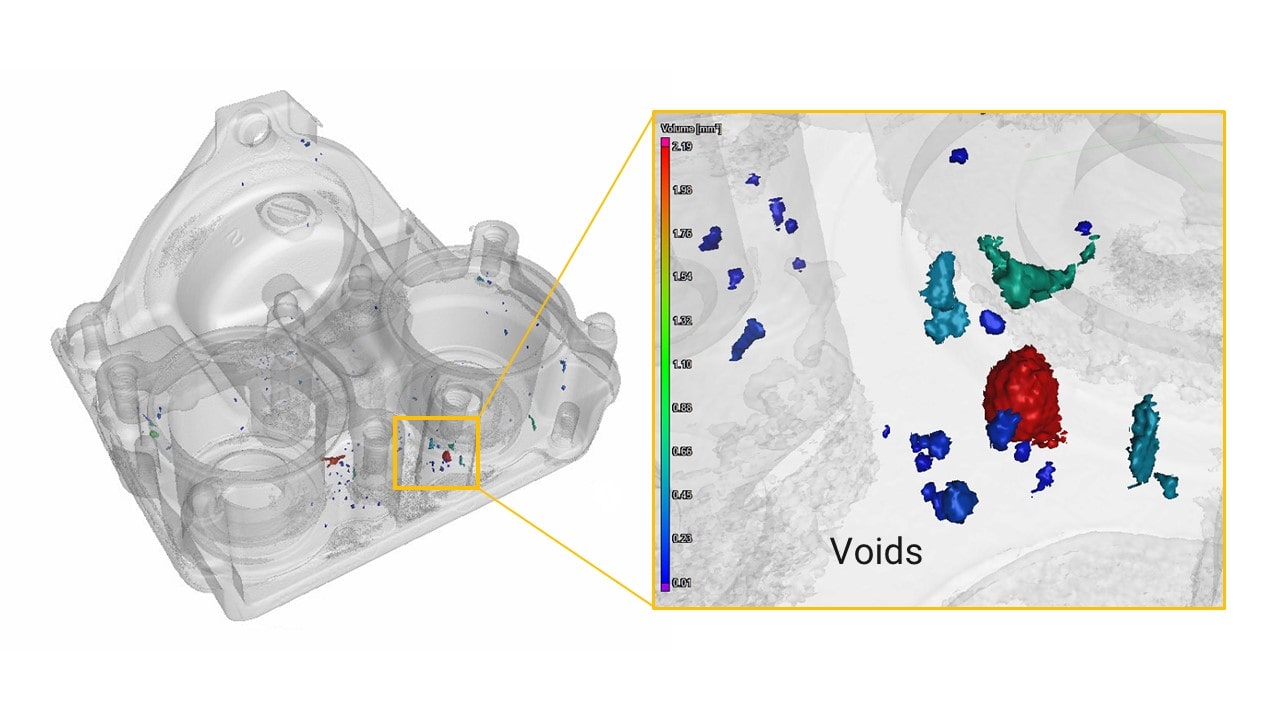
Aluminum die casting void analysis
Application Note
Aluminum part dimensional analysis
Application Note & Video
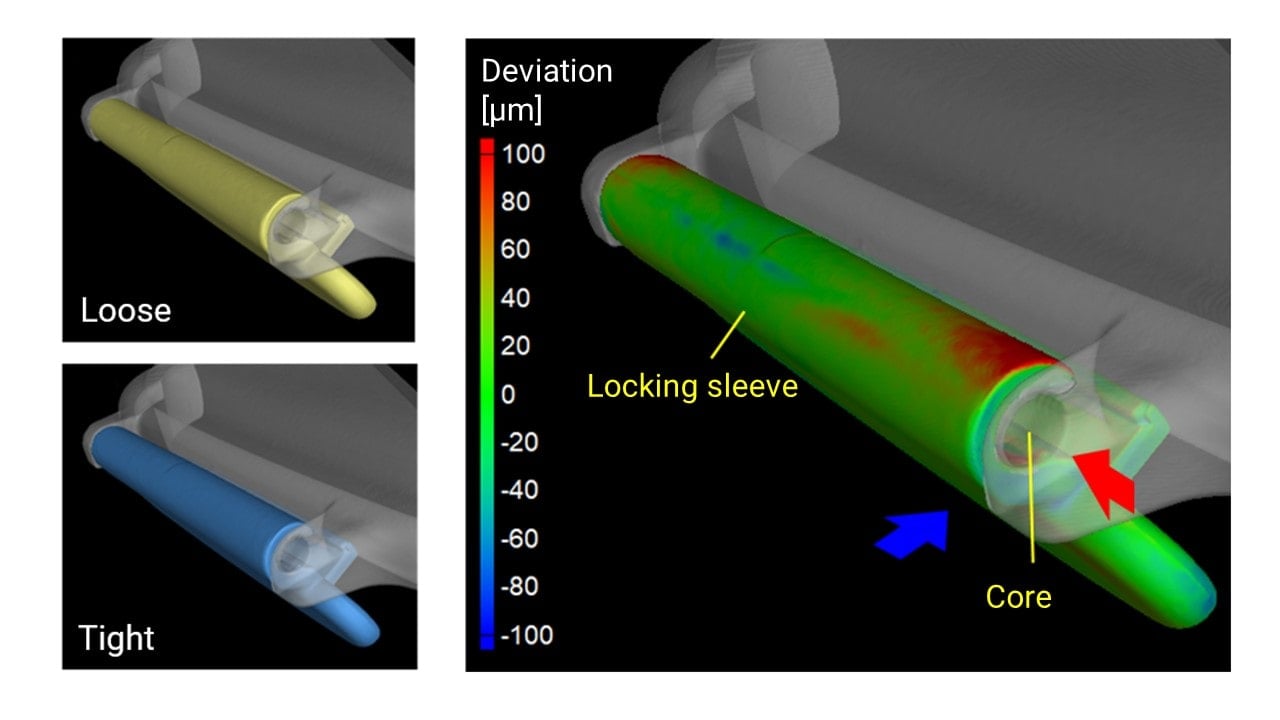
Plastic Locking Parts Dimensional Comparison
Application Note
