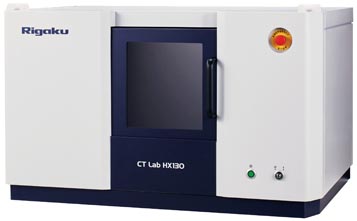
PROCESSED MEAT FAT AND PROTEIN DISTRIBUTION ANALYSIS
About the sample: Processed meat
Meat products processed to improve their taste or shelf life include various components such as fat, protein, air, water, and salt. Their distribution not only can change the taste and texture but also can influence the shelf life. Processed meat products can be sliced and the internal content can be visually inspected. Alternatively, X-ray CT (computed tomography) can be used to reveal three-dimensional structure in micron resolution. The resulting image can be easily segmented into different materials to quantify their characteristics.
Analysis procedure
- In this example, a piece of salami was scanned using a micro-CT scanner, CT Lab HX.
- The resulting image was segmented into fat, protein, and air using the machine learning technique.
- The fat and void distributions were visualized and their volume fractions were calculated.
1. CT scan
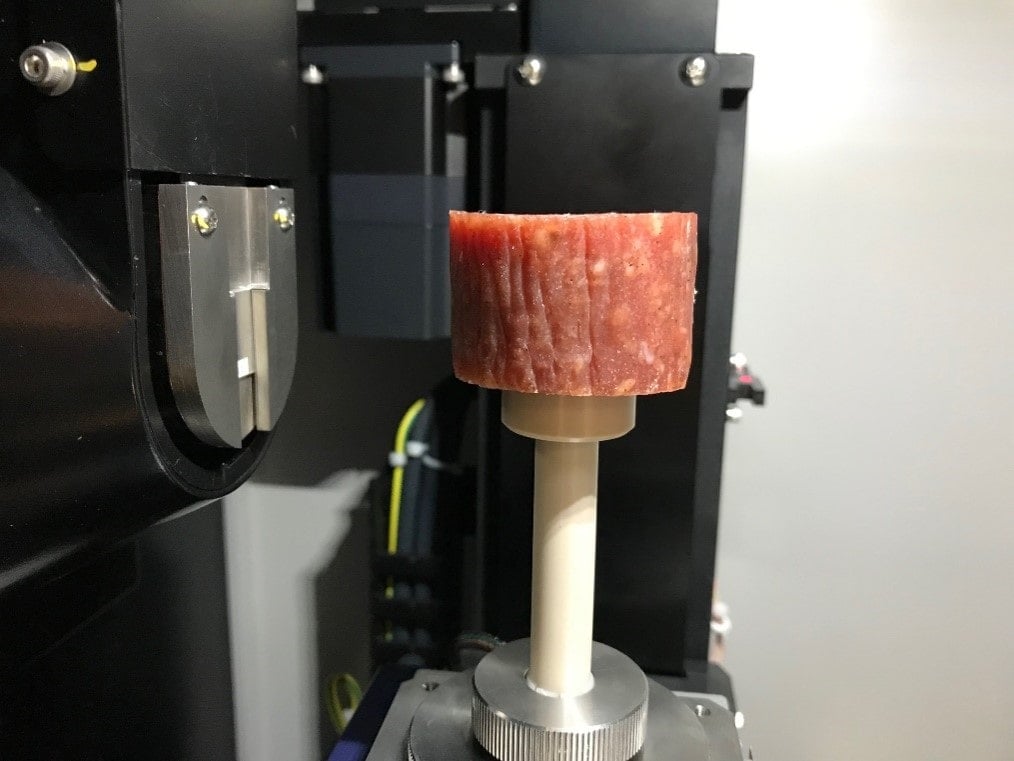
A one-inch thick slice of salami was scanned to produce the 3D grayscale CT image. The sample inside of the CT scanner is shown in the figure.
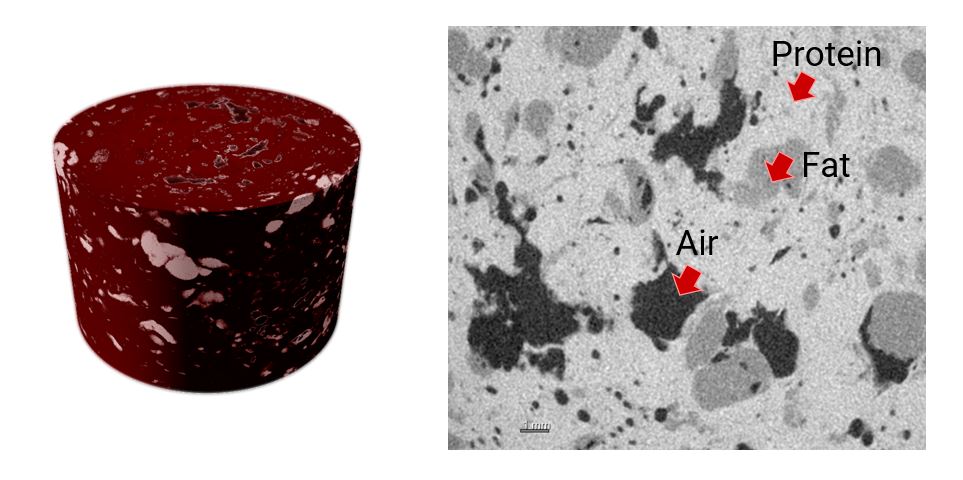
The 3D rendered scan is shown on the left and a cross-section is shown on the right. The gray level in CT data represents the relative density. The protein (light gray), fat (medium gray), and air (dark gray) are clearly distinguished.
2. Segmentation
The resulting image was segmented into fat (beige), protein (red), and air (dark brown) using the machine learning technique. (When there are more than three phases to segment, the machine learning or deep learning method works better than the thresholding method. These two techniques can compensate for the partial volume effect.)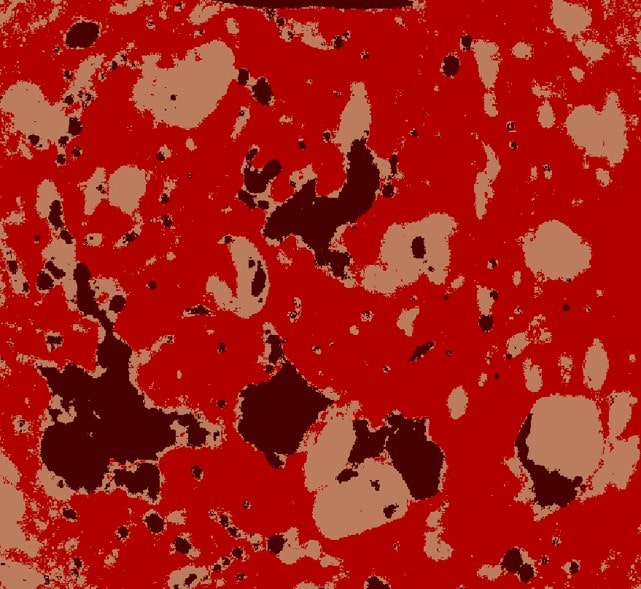
3. Distribution and volume fraction analysis
The fat and void distributions were visualized in 3D. The volume fractions of fat and voids (air) were 17.9 vol% and 9.2 vol%, respectively.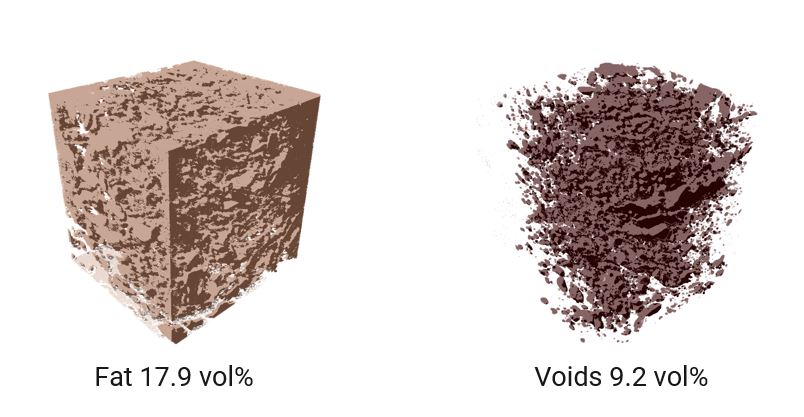
More Food Application Examples
Watch an on-demand webinar about X-ray CT food applications.
Pretzel coating analysis
Application Note

Processed meat fat and protein analysis
Application Note
Processed meat heating experiment
Application Note
Bread dough rising process
Application Note
Breading air oil distribution analysis
Application Note
Chocolate candy sugar coating analysis
Application Note
String cheese texture analysis
Application Note


