CHOCOLATE CANDY COATING ANALYSIS
About the sample: Chocolate candies
There are many types of chocolate candies. Chocolate is the main component, but they can include other components, such as nuts, caramel, and sugar coatings. X-ray CT (computed tomography) can be used to analyze the coating thickness distribution.
Analysis procedure
1. CT scan
A sugar-coated chocolate candy was scanned to produce the 3D grayscale CT image. The top and side view cross-sections are shown in the figure. The gray levels represent the density of materials. Air (cracks and voids) appears black. The sugarcoating is light gray while the chocolate is slightly darker gray. The salt grains are also seen as white dots.
2. Segmentation
The sugar coating was segmented using thresholding and converted into a surface mesh.
3. Thickness distribution analysis
The coating thickness is color-coded in the figure. Thin areas of about 200 microns are shown in blue and the thick areas of about 300 microns are in green. The center of the candy is yellow, indicating that this part is about 500 microns thick.
More Food Application Examples
Watch an on-demand webinar about X-ray CT food applications.
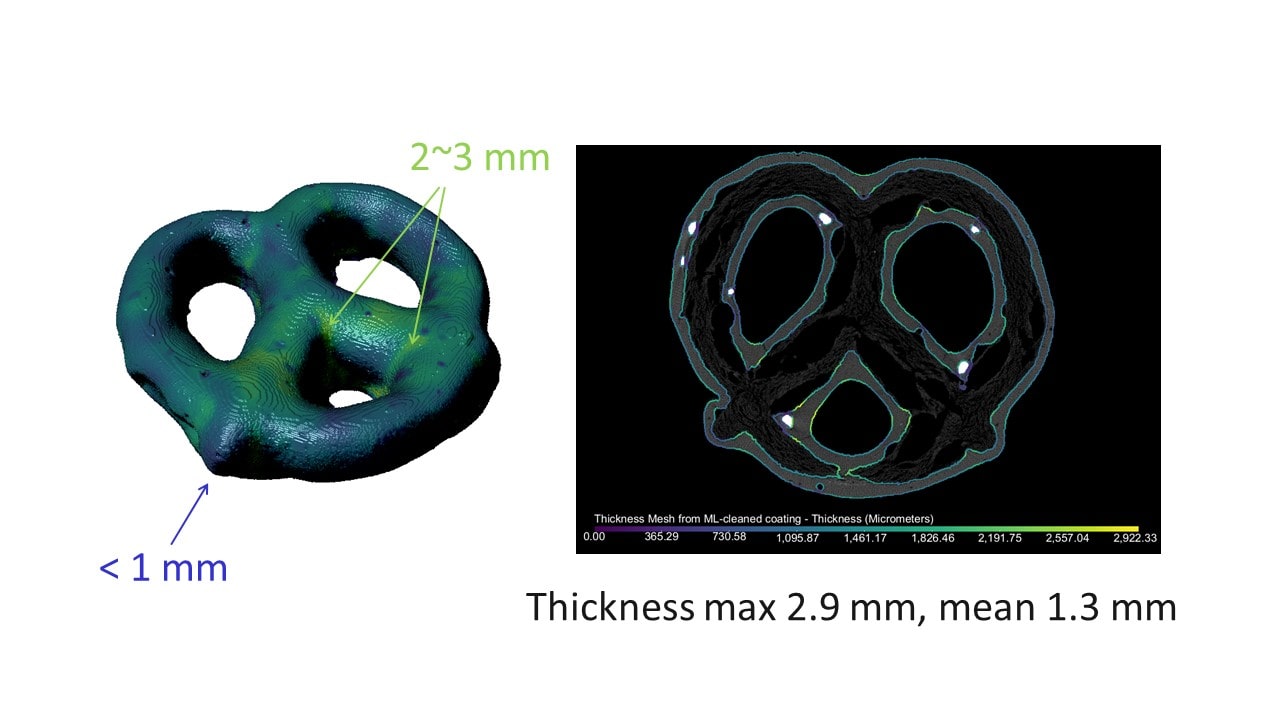
Pretzel coating analysis
Application Note
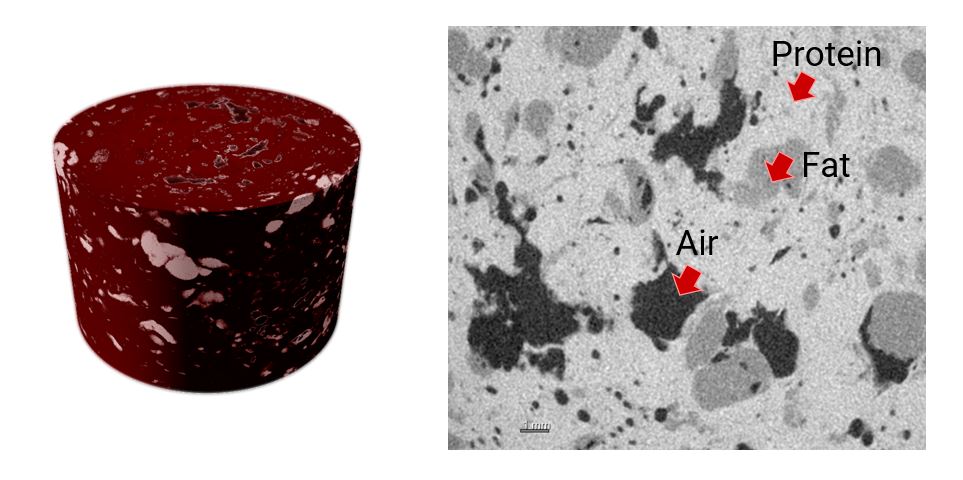
Processed meat fat and protein analysis
Application Note
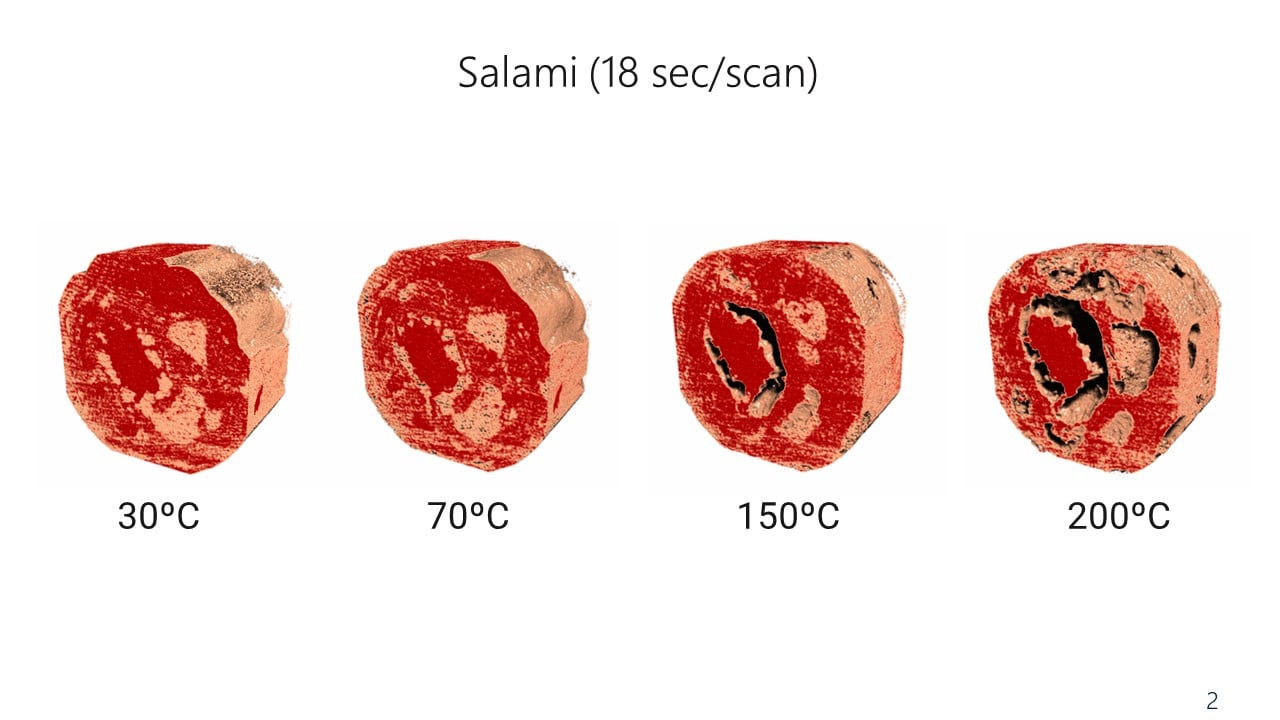
Processed meat heating experiment
Application Note
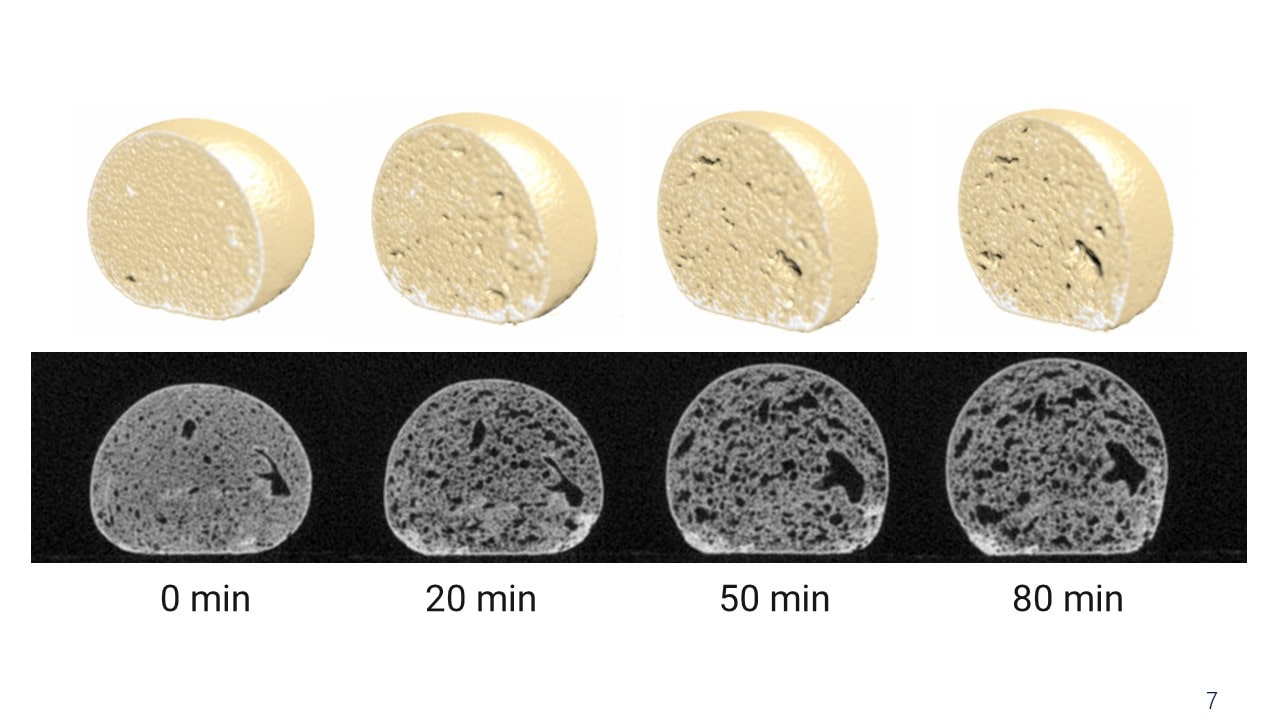
Bread dough rising process
Application Note
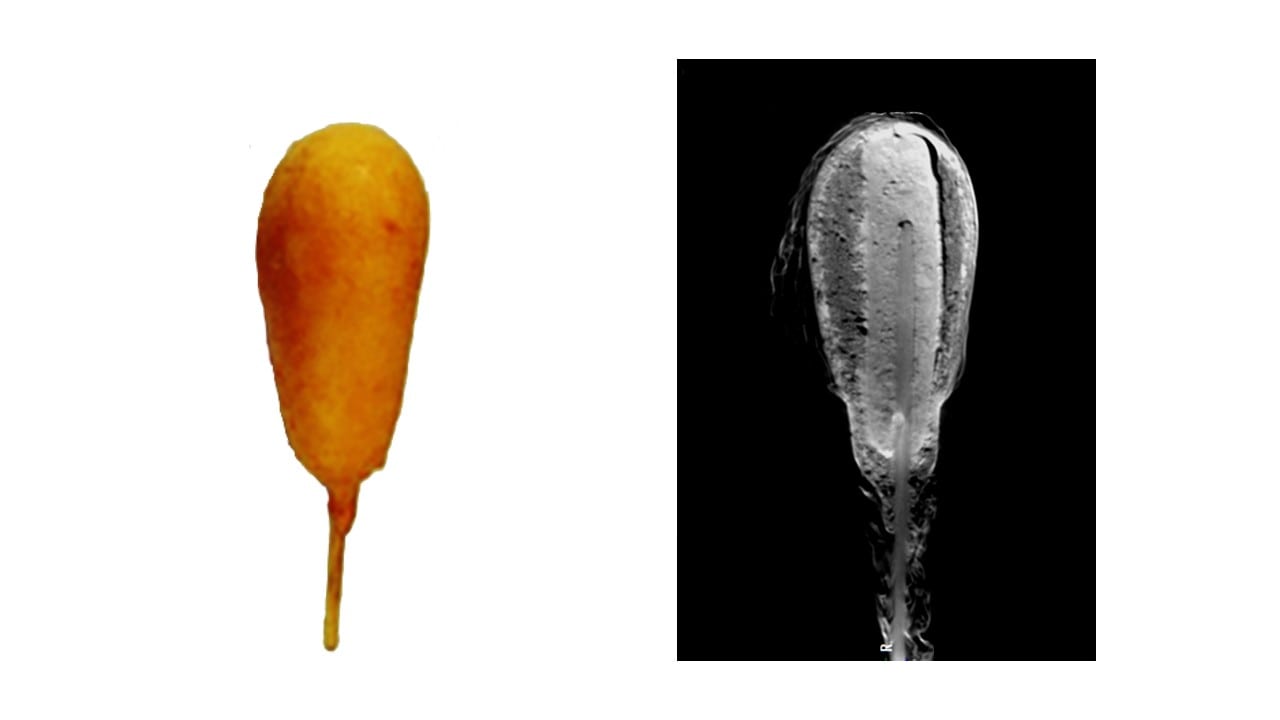
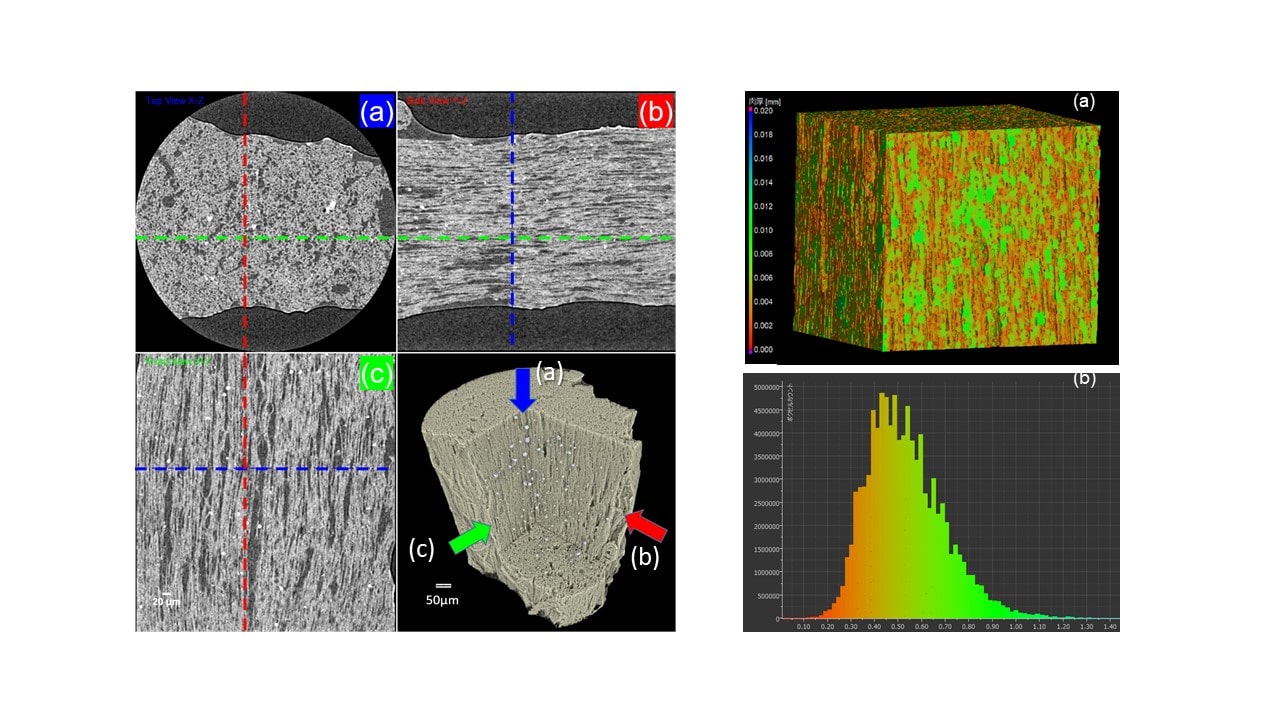
Breading air oil distribution analysis
Application Note
Chocolate candy sugar coating analysis
Application Note
String cheese texture analysis
Application Note